

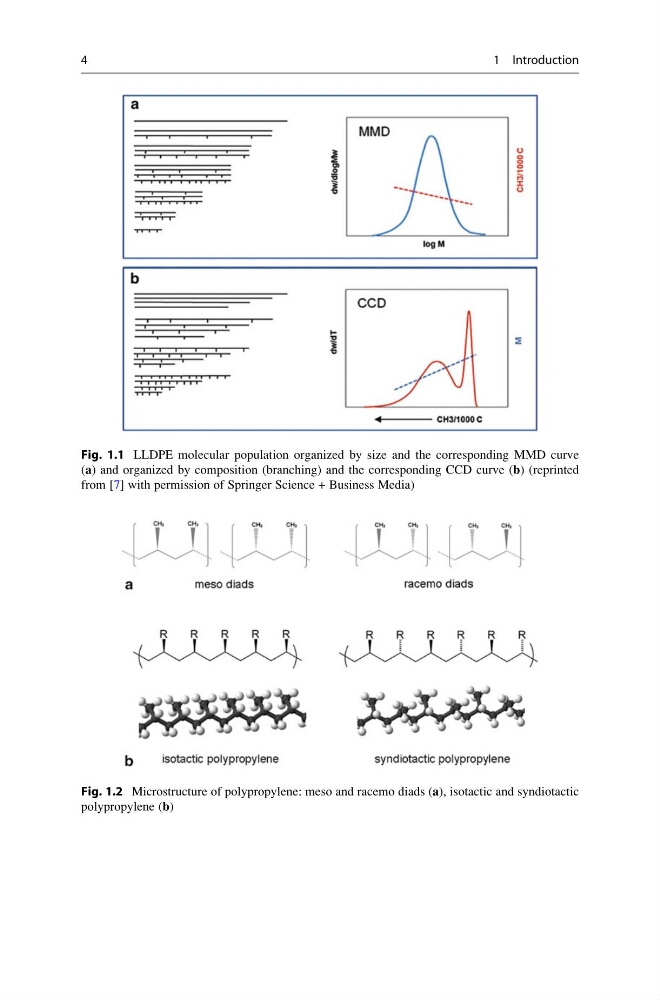
Fig. 1.1 LLDPE molecular population organized by size and the corresponding MMD curve
(a) and organized by composition (branching) and the corresponding CCD curve (b) (reprinted
from [7] with permission of Springer Science + Business Media)
Fig. 1.2 Microstructure of polypropylene: meso and racemo diads (a), isotactic and syndiotactic
polypropylene (b)
4
1 Introduction
(a) and organized by composition (branching) and the corresponding CCD curve (b) (reprinted
from [7] with permission of Springer Science + Business Media)
Fig. 1.2 Microstructure of polypropylene: meso and racemo diads (a), isotactic and syndiotactic
polypropylene (b)
4
1 Introduction