

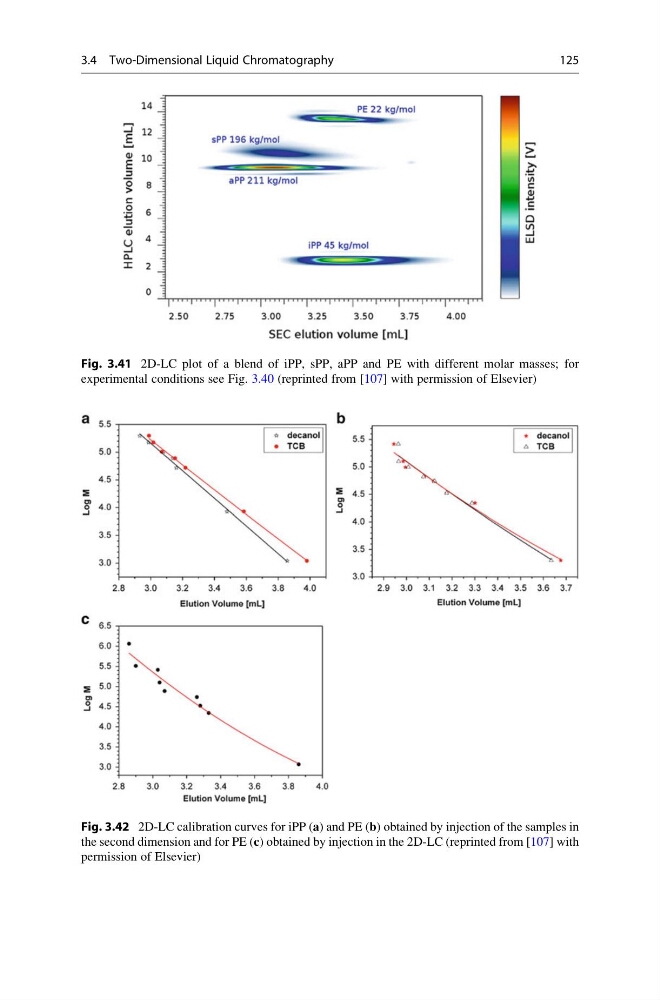
Fig. 3.41 2D-LC plot of a blend of iPP, sPP, aPP and PE with different molar masses; for
experimental conditions see Fig. 3.40 (reprinted from [107] with permission of Elsevier)
Fig. 3.42 2D-LC calibration curves for iPP (a) and PE (b) obtained by injection of the samples in
the second dimension and for PE (c) obtained by injection in the 2D-LC (reprinted from [107] with
permission of Elsevier)
3.4 Two-Dimensional Liquid Chromatography
125
experimental conditions see Fig. 3.40 (reprinted from [107] with permission of Elsevier)
Fig. 3.42 2D-LC calibration curves for iPP (a) and PE (b) obtained by injection of the samples in
the second dimension and for PE (c) obtained by injection in the 2D-LC (reprinted from [107] with
permission of Elsevier)
3.4 Two-Dimensional Liquid Chromatography
125