

It can be clearly seen that aPP and sPP have significantly higher molar masses than
iPP and PE.
A most important yet difficult topic in 2D-LC is calibration of the second
dimension to determine the molar masses of the separated species. In a comprehensive 2D-LC set-up, two chromatographic modes (HPLC and SEC) are coupled
online. This means that the polymer sample is introduced into the SEC column in a
mixed solvent via an automated switching valve. In the present case the composition of the mixed solvent changes from pure 1-decanol to 1-decanol/TCB. The
hydrodynamic volume of the macromolecules may vary in different solvents, which
may result in slight variations from the SEC calibration curve as obtained in a pure
solvent. In order to study the influence of the injection solvent on the behaviour of
macromolecules in SEC, the PE and iPP standards were individually analysed by
SEC. The sample solvent for PE and iPP was either 1-decanol or TCB. SEC
calibration curves constructed for both iPP and PE standards are shown in
Fig. 3.42. There are variations in the calibration curves of iPP standards with
different injection solvents, in contrast to PE standards that show no effect of the
injection volume except for the low molar mass region. It is, therefore, important to
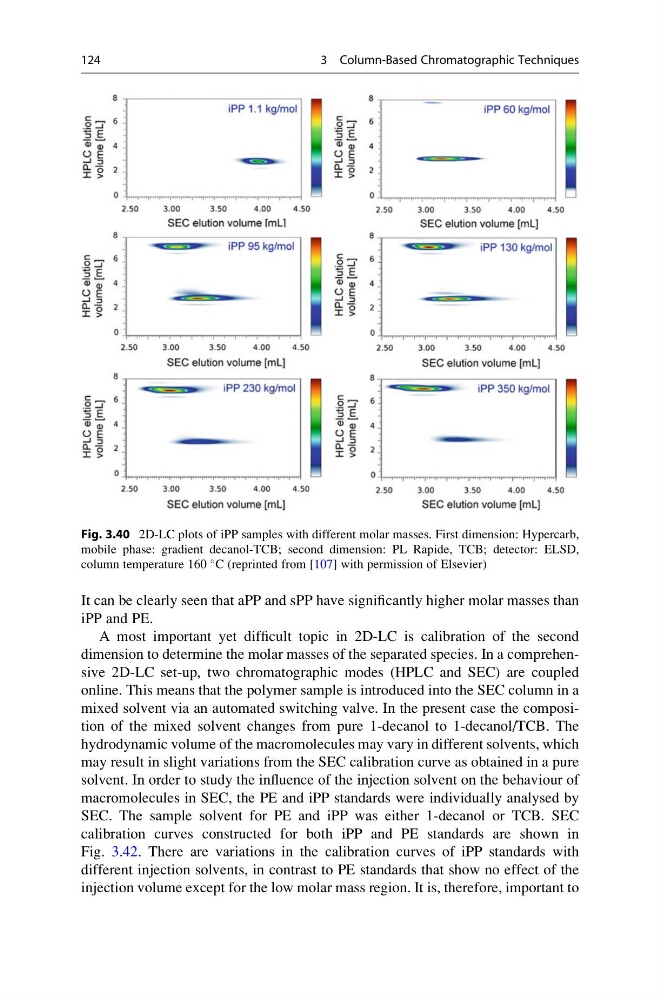
Fig. 3.40 2D-LC plots of iPP samples with different molar masses. First dimension: Hypercarb,
mobile phase: gradient decanol-TCB; second dimension: PL Rapide, TCB; detector: ELSD,
column temperature 160
C (reprinted from [107] with permission of Elsevier)
124
3 Column-Based Chromatographic Techniques
iPP and PE.
A most important yet difficult topic in 2D-LC is calibration of the second
dimension to determine the molar masses of the separated species. In a comprehensive 2D-LC set-up, two chromatographic modes (HPLC and SEC) are coupled
online. This means that the polymer sample is introduced into the SEC column in a
mixed solvent via an automated switching valve. In the present case the composition of the mixed solvent changes from pure 1-decanol to 1-decanol/TCB. The
hydrodynamic volume of the macromolecules may vary in different solvents, which
may result in slight variations from the SEC calibration curve as obtained in a pure
solvent. In order to study the influence of the injection solvent on the behaviour of
macromolecules in SEC, the PE and iPP standards were individually analysed by
SEC. The sample solvent for PE and iPP was either 1-decanol or TCB. SEC
calibration curves constructed for both iPP and PE standards are shown in
Fig. 3.42. There are variations in the calibration curves of iPP standards with
different injection solvents, in contrast to PE standards that show no effect of the
injection volume except for the low molar mass region. It is, therefore, important to
Fig. 3.40 2D-LC plots of iPP samples with different molar masses. First dimension: Hypercarb,
mobile phase: gradient decanol-TCB; second dimension: PL Rapide, TCB; detector: ELSD,
column temperature 160
C (reprinted from [107] with permission of Elsevier)
124
3 Column-Based Chromatographic Techniques