

ppm
0.5
1.0
1.5
2.0
2.5
3.0
3.5
4.0
ppm
65
60
55
50
45
40
35
30
25
20
15
10
5
5(m,r)
6(m)
6(m)
6(r)
1,7,8(m)
8(r)
CH 3 (PE)
CH(PE)
8(r)
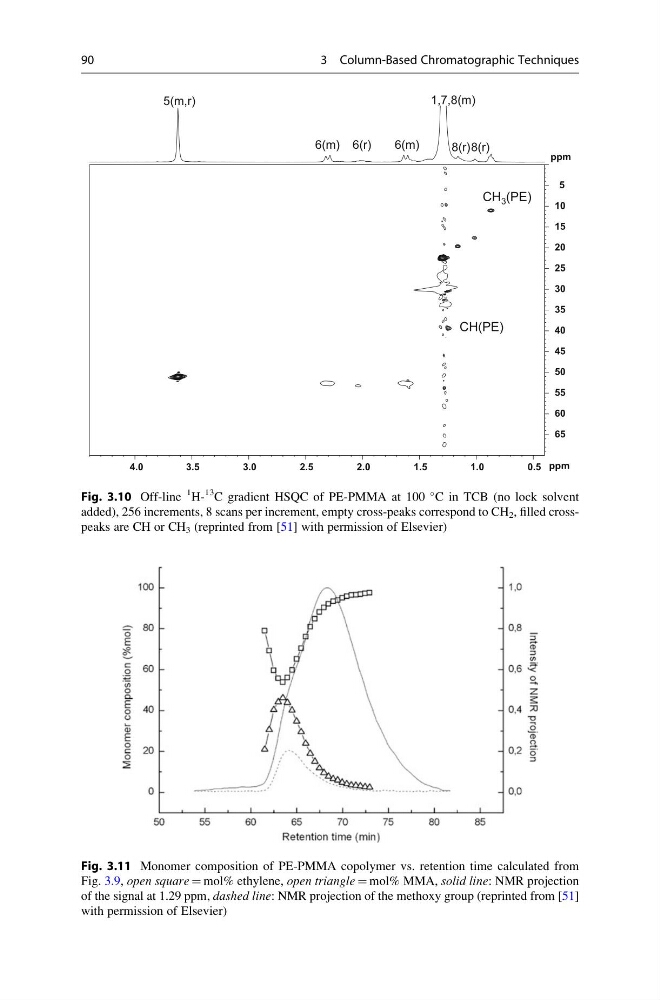
Fig. 3.10 Off-line
1 H13
C gradient HSQC of PE-PMMA at 100
C in TCB (no lock solvent
added), 256 increments, 8 scans per increment, empty cross-peaks correspond to CH 2 , filled crosspeaks are CH or CH 3 (reprinted from [51] with permission of Elsevier)
Fig. 3.11 Monomer composition of PE-PMMA copolymer vs. retention time calculated from
Fig. 3.9, open square ¼ mol% ethylene, open triangle ¼ mol% MMA, solid line: NMR projection
of the signal at 1.29 ppm, dashed line: NMR projection of the methoxy group (reprinted from [51]
with permission of Elsevier)
90
3 Column-Based Chromatographic Techniques
0.5
1.0
1.5
2.0
2.5
3.0
3.5
4.0
ppm
65
60
55
50
45
40
35
30
25
20
15
10
5
5(m,r)
6(m)
6(m)
6(r)
1,7,8(m)
8(r)
CH 3 (PE)
CH(PE)
8(r)
Fig. 3.10 Off-line
1 H13
C gradient HSQC of PE-PMMA at 100
C in TCB (no lock solvent
added), 256 increments, 8 scans per increment, empty cross-peaks correspond to CH 2 , filled crosspeaks are CH or CH 3 (reprinted from [51] with permission of Elsevier)
Fig. 3.11 Monomer composition of PE-PMMA copolymer vs. retention time calculated from
Fig. 3.9, open square ¼ mol% ethylene, open triangle ¼ mol% MMA, solid line: NMR projection
of the signal at 1.29 ppm, dashed line: NMR projection of the methoxy group (reprinted from [51]
with permission of Elsevier)
90
3 Column-Based Chromatographic Techniques