

7. Select parameters for the kinetic analysis and determination of
the affinity constant as described in [19]. After curve-fitting,
the lower concentrations are used for determining the kinetic
and affinity constants (Table 2). The results shown in Table 2
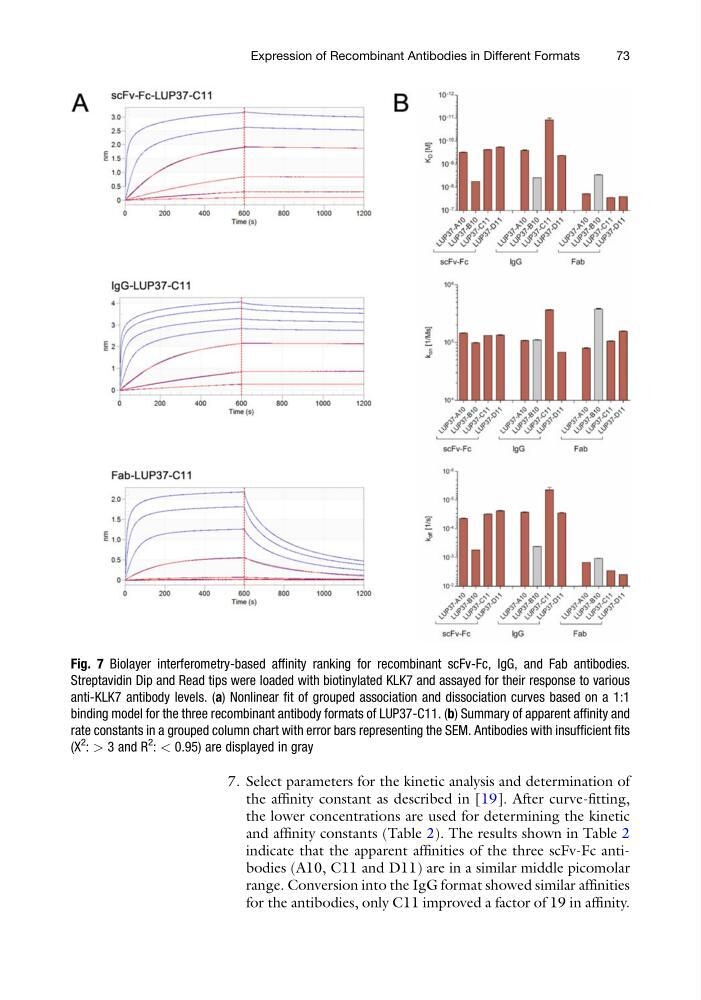
indicate that the apparent affinities of the three scFv-Fc antibodies (A10, C11 and D11) are in a similar middle picomolar
range. Conversion into the IgG format showed similar affinities
for the antibodies, only C11 improved a factor of 19 in affinity.
Fig. 7 Biolayer interferometry-based affinity ranking for recombinant scFv-Fc, IgG, and Fab antibodies.
Streptavidin Dip and Read tips were loaded with biotinylated KLK7 and assayed for their response to various
anti-KLK7 antibody levels. (a) Nonlinear fit of grouped association and dissociation curves based on a 1:1
binding model for the three recombinant antibody formats of LUP37-C11. (b) Summary of apparent affinity and
rate constants in a grouped column chart with error bars representing the SEM. Antibodies with insufficient fits
(X
2
: > 3 and R
2
: < 0.95) are displayed in gray
Expression of Recombinant Antibodies in Different Formats
73
the affinity constant as described in [19]. After curve-fitting,
the lower concentrations are used for determining the kinetic
and affinity constants (Table 2). The results shown in Table 2
indicate that the apparent affinities of the three scFv-Fc antibodies (A10, C11 and D11) are in a similar middle picomolar
range. Conversion into the IgG format showed similar affinities
for the antibodies, only C11 improved a factor of 19 in affinity.
Fig. 7 Biolayer interferometry-based affinity ranking for recombinant scFv-Fc, IgG, and Fab antibodies.
Streptavidin Dip and Read tips were loaded with biotinylated KLK7 and assayed for their response to various
anti-KLK7 antibody levels. (a) Nonlinear fit of grouped association and dissociation curves based on a 1:1
binding model for the three recombinant antibody formats of LUP37-C11. (b) Summary of apparent affinity and
rate constants in a grouped column chart with error bars representing the SEM. Antibodies with insufficient fits
(X
2
: > 3 and R
2
: < 0.95) are displayed in gray
Expression of Recombinant Antibodies in Different Formats
73