

Table 1
Settings for the biolayer interferometric kinetic measurements
Step
Step name
Time [s]
Flow [rpm]
Sample plate column
Run 1
Run 2
Run 3
1
Equilibration
60
1000
1
1
1
2
Loading
300
1000
2
2
2
3
Baseline
60
1000
3
3
3
4
Association
600
1000
4
6
8
5
Dissociation
600
1000
5
7
9
6
Regeneration
30
1000
11,12
11,12
11,12
The experiment was repeated after regeneration of the tips using the different antibody formats in column 4, 6, and
8 respectively
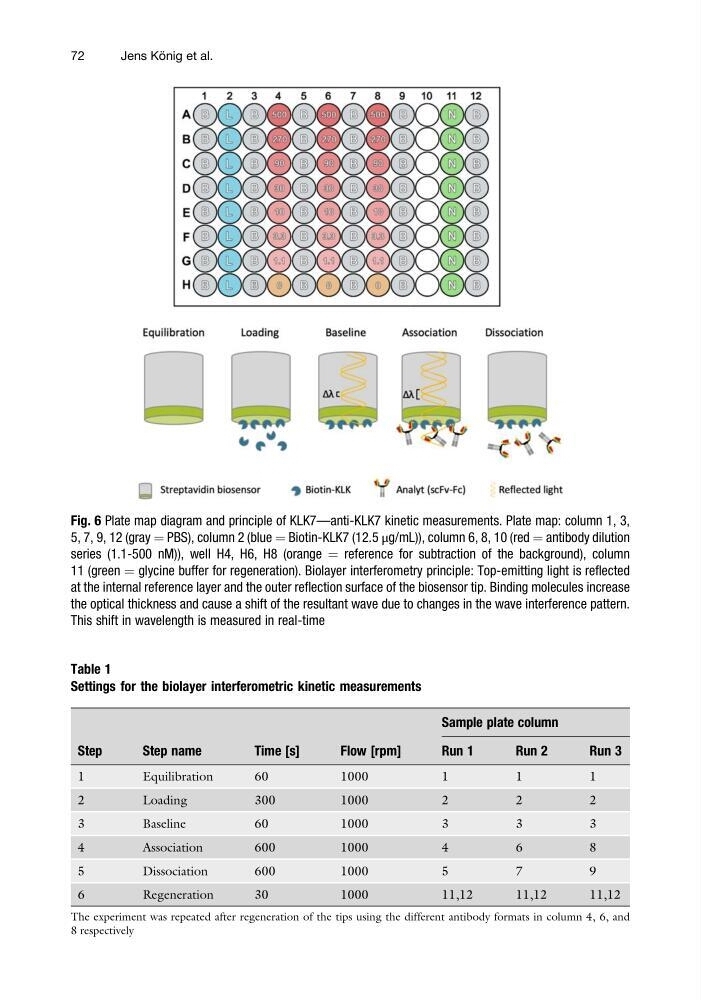
Fig. 6 Plate map diagram and principle of KLK7—anti-KLK7 kinetic measurements. Plate map: column 1, 3,
5, 7, 9, 12 (gray ¼ PBS), column 2 (blue ¼ Biotin-KLK7 (12.5 μg/mL)), column 6, 8, 10 (red ¼ antibody dilution
series (1.1-500 nM)), well H4, H6, H8 (orange ¼ reference for subtraction of the background), column
11 (green ¼ glycine buffer for regeneration). Biolayer interferometry principle: Top-emitting light is reflected
at the internal reference layer and the outer reflection surface of the biosensor tip. Binding molecules increase
the optical thickness and cause a shift of the resultant wave due to changes in the wave interference pattern.
This shift in wavelength is measured in real-time
72
Jens Ko ¨ nig et al.
Settings for the biolayer interferometric kinetic measurements
Step
Step name
Time [s]
Flow [rpm]
Sample plate column
Run 1
Run 2
Run 3
1
Equilibration
60
1000
1
1
1
2
Loading
300
1000
2
2
2
3
Baseline
60
1000
3
3
3
4
Association
600
1000
4
6
8
5
Dissociation
600
1000
5
7
9
6
Regeneration
30
1000
11,12
11,12
11,12
The experiment was repeated after regeneration of the tips using the different antibody formats in column 4, 6, and
8 respectively
Fig. 6 Plate map diagram and principle of KLK7—anti-KLK7 kinetic measurements. Plate map: column 1, 3,
5, 7, 9, 12 (gray ¼ PBS), column 2 (blue ¼ Biotin-KLK7 (12.5 μg/mL)), column 6, 8, 10 (red ¼ antibody dilution
series (1.1-500 nM)), well H4, H6, H8 (orange ¼ reference for subtraction of the background), column
11 (green ¼ glycine buffer for regeneration). Biolayer interferometry principle: Top-emitting light is reflected
at the internal reference layer and the outer reflection surface of the biosensor tip. Binding molecules increase
the optical thickness and cause a shift of the resultant wave due to changes in the wave interference pattern.
This shift in wavelength is measured in real-time
72
Jens Ko ¨ nig et al.