

6. Repeat with the cell population to be sorted and verify that the
CRISPR/Cas9-modified cells can be differentiated from
parental cells. Run the transfected cells to quantify the amount
of fluorescently labeled cells and define the collection gate. The
fluorescent signal depends on expression levels of the target
gene and can be relatively dim (Fig. 6b).
7. Sort the positive cells into the 96-well plates and incubate at
37
C, 5% CO 2 .
8. After ~5 days, identify 24 single-cell clones for validation and
keep them growing. Maintain the cells in 96-well plates until
you can proceed to validation. Split cells by trypsinization when
required.
3.5 Validation
of Selected Clones
This section details: (1) genotyping of the knock-in cell clones by
PCR to verify that the fluorescent marker was correctly inserted at
the target locus and to test for homozygosity, (2) Western blot
analysis to verify that the GFP fusion protein is effectively
expressed, and (3) fluorescence microscopy to validate expression
and localization of the tagged protein.
3.5.1 Validation
at the Genomic Level
1. Split cells from each positive well into two 96-well plates. The
day after, spin down and wash the cells in one of the plates
with PBS.
GFP-FL
GFP-FL
FSC
FSC
B
A
10
5
10
4
10
3
10
2
10
2
10
3
10
4
10
5
10
2
10
3
10
4
10
5
10
5
10
4
10
3
10
2
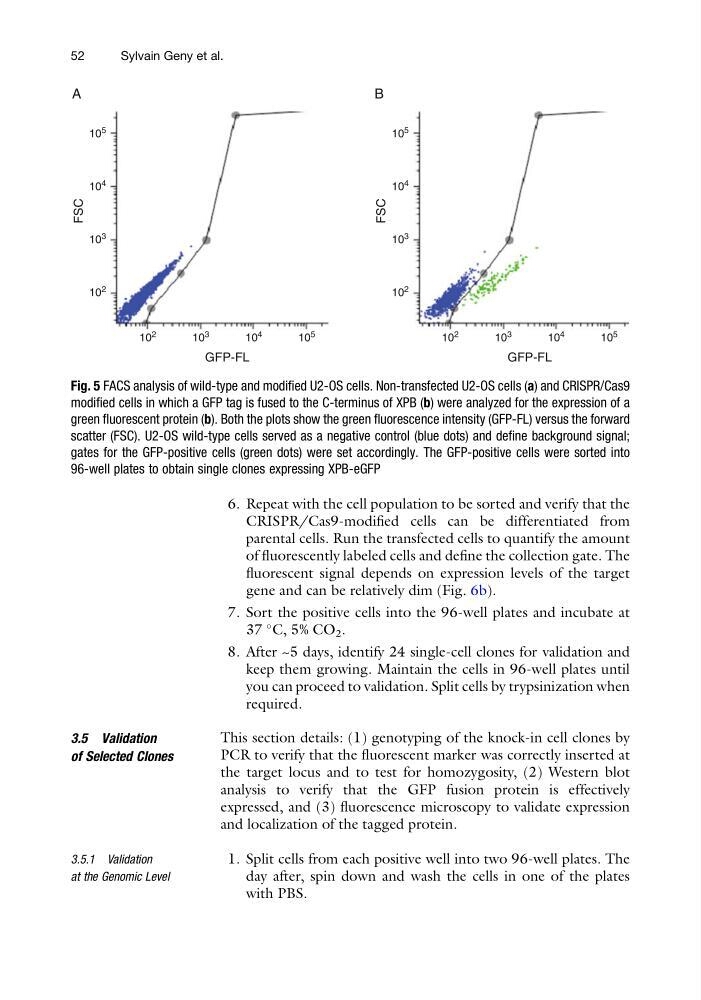
Fig. 5 FACS analysis of wild-type and modified U2-OS cells. Non-transfected U2-OS cells (a) and CRISPR/Cas9
modified cells in which a GFP tag is fused to the C-terminus of XPB (b) were analyzed for the expression of a
green fluorescent protein (b). Both the plots show the green fluorescence intensity (GFP-FL) versus the forward
scatter (FSC). U2-OS wild-type cells served as a negative control (blue dots) and define background signal;
gates for the GFP-positive cells (green dots) were set accordingly. The GFP-positive cells were sorted into
96-well plates to obtain single clones expressing XPB-eGFP
52
Sylvain Geny et al.
CRISPR/Cas9-modified cells can be differentiated from
parental cells. Run the transfected cells to quantify the amount
of fluorescently labeled cells and define the collection gate. The
fluorescent signal depends on expression levels of the target
gene and can be relatively dim (Fig. 6b).
7. Sort the positive cells into the 96-well plates and incubate at
37
C, 5% CO 2 .
8. After ~5 days, identify 24 single-cell clones for validation and
keep them growing. Maintain the cells in 96-well plates until
you can proceed to validation. Split cells by trypsinization when
required.
3.5 Validation
of Selected Clones
This section details: (1) genotyping of the knock-in cell clones by
PCR to verify that the fluorescent marker was correctly inserted at
the target locus and to test for homozygosity, (2) Western blot
analysis to verify that the GFP fusion protein is effectively
expressed, and (3) fluorescence microscopy to validate expression
and localization of the tagged protein.
3.5.1 Validation
at the Genomic Level
1. Split cells from each positive well into two 96-well plates. The
day after, spin down and wash the cells in one of the plates
with PBS.
GFP-FL
GFP-FL
FSC
FSC
B
A
10
5
10
4
10
3
10
2
10
2
10
3
10
4
10
5
10
2
10
3
10
4
10
5
10
5
10
4
10
3
10
2
Fig. 5 FACS analysis of wild-type and modified U2-OS cells. Non-transfected U2-OS cells (a) and CRISPR/Cas9
modified cells in which a GFP tag is fused to the C-terminus of XPB (b) were analyzed for the expression of a
green fluorescent protein (b). Both the plots show the green fluorescence intensity (GFP-FL) versus the forward
scatter (FSC). U2-OS wild-type cells served as a negative control (blue dots) and define background signal;
gates for the GFP-positive cells (green dots) were set accordingly. The GFP-positive cells were sorted into
96-well plates to obtain single clones expressing XPB-eGFP
52
Sylvain Geny et al.