

emission), fluorescein at pH 7–10 (488 nm excitation, 515 nm
emission), and rhodamine B (543–561 nm excitation, 590 nm
emission).
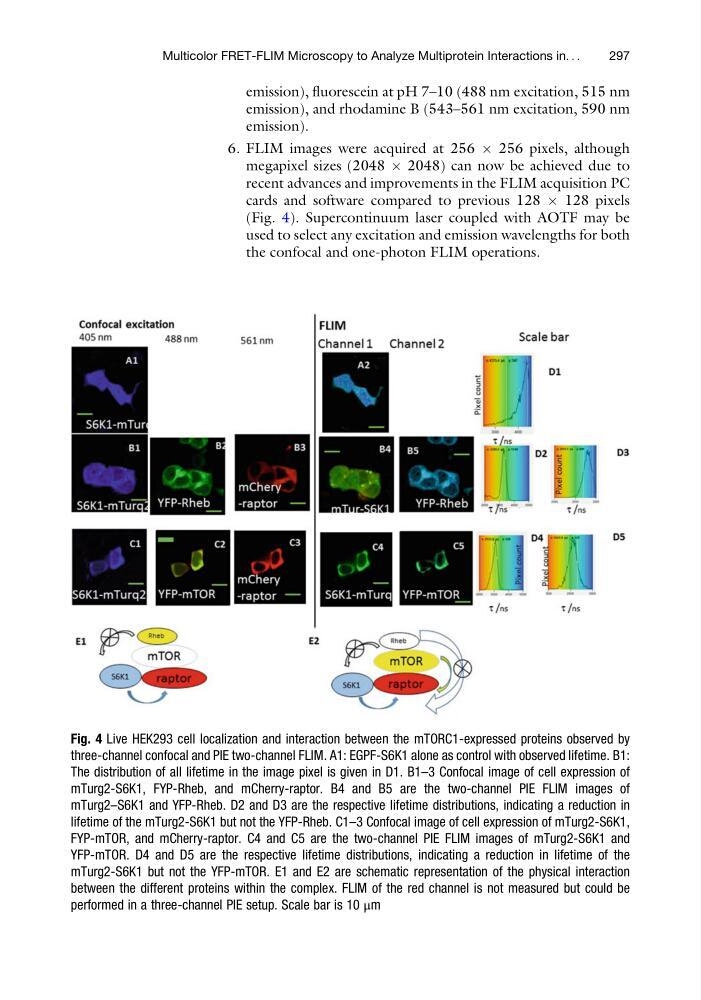
6. FLIM images were acquired at 256 Â 256 pixels, although
megapixel sizes (2048 Â 2048) can now be achieved due to
recent advances and improvements in the FLIM acquisition PC
cards and software compared to previous 128 Â 128 pixels
(Fig. 4). Supercontinuum laser coupled with AOTF may be
used to select any excitation and emission wavelengths for both
the confocal and one-photon FLIM operations.
Fig. 4 Live HEK293 cell localization and interaction between the mTORC1-expressed proteins observed by
three-channel confocal and PIE two-channel FLIM. A1: EGPF-S6K1 alone as control with observed lifetime. B1:
The distribution of all lifetime in the image pixel is given in D1. B1–3 Confocal image of cell expression of
mTurg2-S6K1, FYP-Rheb, and mCherry-raptor. B4 and B5 are the two-channel PIE FLIM images of
mTurg2–S6K1 and YFP-Rheb. D2 and D3 are the respective lifetime distributions, indicating a reduction in
lifetime of the mTurg2-S6K1 but not the YFP-Rheb. C1–3 Confocal image of cell expression of mTurg2-S6K1,
FYP-mTOR, and mCherry-raptor. C4 and C5 are the two-channel PIE FLIM images of mTurg2-S6K1 and
YFP-mTOR. D4 and D5 are the respective lifetime distributions, indicating a reduction in lifetime of the
mTurg2-S6K1 but not the YFP-mTOR. E1 and E2 are schematic representation of the physical interaction
between the different proteins within the complex. FLIM of the red channel is not measured but could be
performed in a three-channel PIE setup. Scale bar is 10 μm
Multicolor FRET-FLIM Microscopy to Analyze Multiprotein Interactions in. . .
297
emission), and rhodamine B (543–561 nm excitation, 590 nm
emission).
6. FLIM images were acquired at 256 Â 256 pixels, although
megapixel sizes (2048 Â 2048) can now be achieved due to
recent advances and improvements in the FLIM acquisition PC
cards and software compared to previous 128 Â 128 pixels
(Fig. 4). Supercontinuum laser coupled with AOTF may be
used to select any excitation and emission wavelengths for both
the confocal and one-photon FLIM operations.
Fig. 4 Live HEK293 cell localization and interaction between the mTORC1-expressed proteins observed by
three-channel confocal and PIE two-channel FLIM. A1: EGPF-S6K1 alone as control with observed lifetime. B1:
The distribution of all lifetime in the image pixel is given in D1. B1–3 Confocal image of cell expression of
mTurg2-S6K1, FYP-Rheb, and mCherry-raptor. B4 and B5 are the two-channel PIE FLIM images of
mTurg2–S6K1 and YFP-Rheb. D2 and D3 are the respective lifetime distributions, indicating a reduction in
lifetime of the mTurg2-S6K1 but not the YFP-Rheb. C1–3 Confocal image of cell expression of mTurg2-S6K1,
FYP-mTOR, and mCherry-raptor. C4 and C5 are the two-channel PIE FLIM images of mTurg2-S6K1 and
YFP-mTOR. D4 and D5 are the respective lifetime distributions, indicating a reduction in lifetime of the
mTurg2-S6K1 but not the YFP-mTOR. E1 and E2 are schematic representation of the physical interaction
between the different proteins within the complex. FLIM of the red channel is not measured but could be
performed in a three-channel PIE setup. Scale bar is 10 μm
Multicolor FRET-FLIM Microscopy to Analyze Multiprotein Interactions in. . .
297