

localizations that may compromise single-molecule detection can
be removed as well. An additional problem for data quantification
can be relocalization events (fluorophores that appear more than
once during the acquisition); these can be addressed by taking into
account the blinking behavior of fluorophores [31].
3.8 SMLM Data
Segmentation
and Cluster Analysis,
from 2D to 3D
Advanced SMLM data processing techniques include
co-localization and cluster analysis. While for classical microscopy
data, these are commonly done on images, analysis of SMLM
images is less optimal, because the image is not the primary data
type, and moreover, they are not built in a unique way (see Subheading 3.6). To get most information from the data, it is preferred
to process directly the localization coordinates.
Cluster analysis or segmentation aims for the detection of
accumulations (clusters) of fluorescently labeled objects, such as
proteins or nucleic acids. These detected clusters should then be
analyzed for their size, density distribution, etc. Two types of
cluster analysis can be distinguished: determination of global properties of data and detailed analysis of individual clusters. For the first
part of the analysis, the method of choice is Ripley’s K- and
L-functions [32, 33]. It allows to, first, test whether or not the
experimental distribution follows a given pattern, and, second, to
find the characteristic size of clusters [8]. A similar method was also
developed for the estimation of colocalization between two experimental distributions [10], it provides a colocalization value for a
region that reflects the global colocalization extent within this
region.
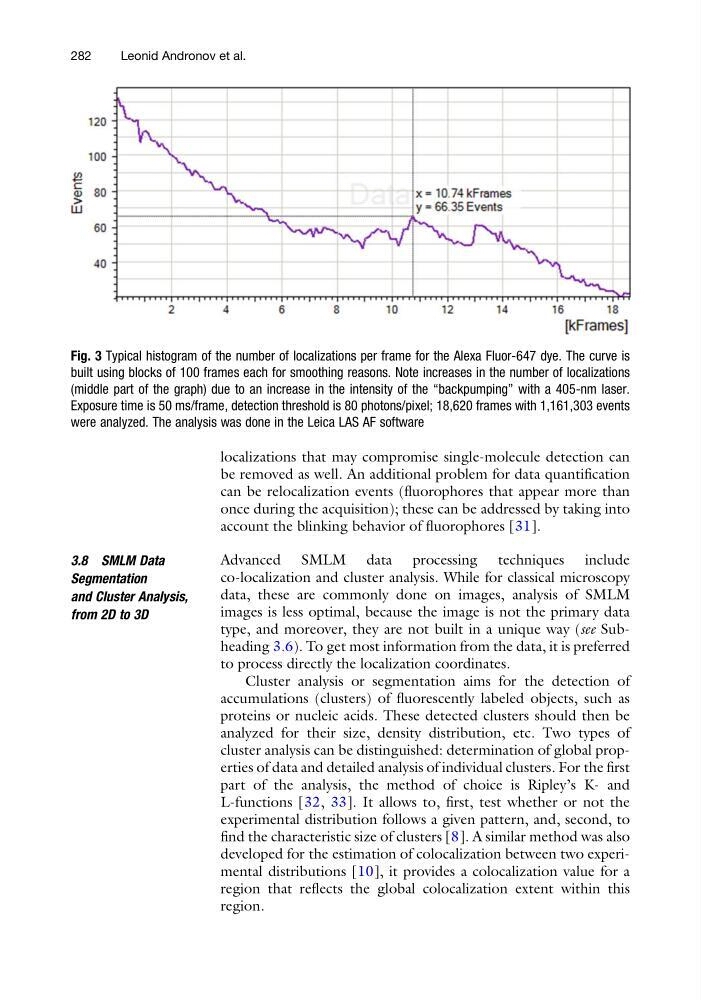
Fig. 3 Typical histogram of the number of localizations per frame for the Alexa Fluor-647 dye. The curve is
built using blocks of 100 frames each for smoothing reasons. Note increases in the number of localizations
(middle part of the graph) due to an increase in the intensity of the “backpumping” with a 405-nm laser.
Exposure time is 50 ms/frame, detection threshold is 80 photons/pixel; 18,620 frames with 1,161,303 events
were analyzed. The analysis was done in the Leica LAS AF software
282
Leonid Andronov et al.
be removed as well. An additional problem for data quantification
can be relocalization events (fluorophores that appear more than
once during the acquisition); these can be addressed by taking into
account the blinking behavior of fluorophores [31].
3.8 SMLM Data
Segmentation
and Cluster Analysis,
from 2D to 3D
Advanced SMLM data processing techniques include
co-localization and cluster analysis. While for classical microscopy
data, these are commonly done on images, analysis of SMLM
images is less optimal, because the image is not the primary data
type, and moreover, they are not built in a unique way (see Subheading 3.6). To get most information from the data, it is preferred
to process directly the localization coordinates.
Cluster analysis or segmentation aims for the detection of
accumulations (clusters) of fluorescently labeled objects, such as
proteins or nucleic acids. These detected clusters should then be
analyzed for their size, density distribution, etc. Two types of
cluster analysis can be distinguished: determination of global properties of data and detailed analysis of individual clusters. For the first
part of the analysis, the method of choice is Ripley’s K- and
L-functions [32, 33]. It allows to, first, test whether or not the
experimental distribution follows a given pattern, and, second, to
find the characteristic size of clusters [8]. A similar method was also
developed for the estimation of colocalization between two experimental distributions [10], it provides a colocalization value for a
region that reflects the global colocalization extent within this
region.
Fig. 3 Typical histogram of the number of localizations per frame for the Alexa Fluor-647 dye. The curve is
built using blocks of 100 frames each for smoothing reasons. Note increases in the number of localizations
(middle part of the graph) due to an increase in the intensity of the “backpumping” with a 405-nm laser.
Exposure time is 50 ms/frame, detection threshold is 80 photons/pixel; 18,620 frames with 1,161,303 events
were analyzed. The analysis was done in the Leica LAS AF software
282
Leonid Andronov et al.