

0.11 mbar using argon (available for the upgraded LCT) in
order to optimize the transmission of high molecular species
for native MS application.
4. Start a 2-min acquisition in the 1,000–20,000 m/z range.
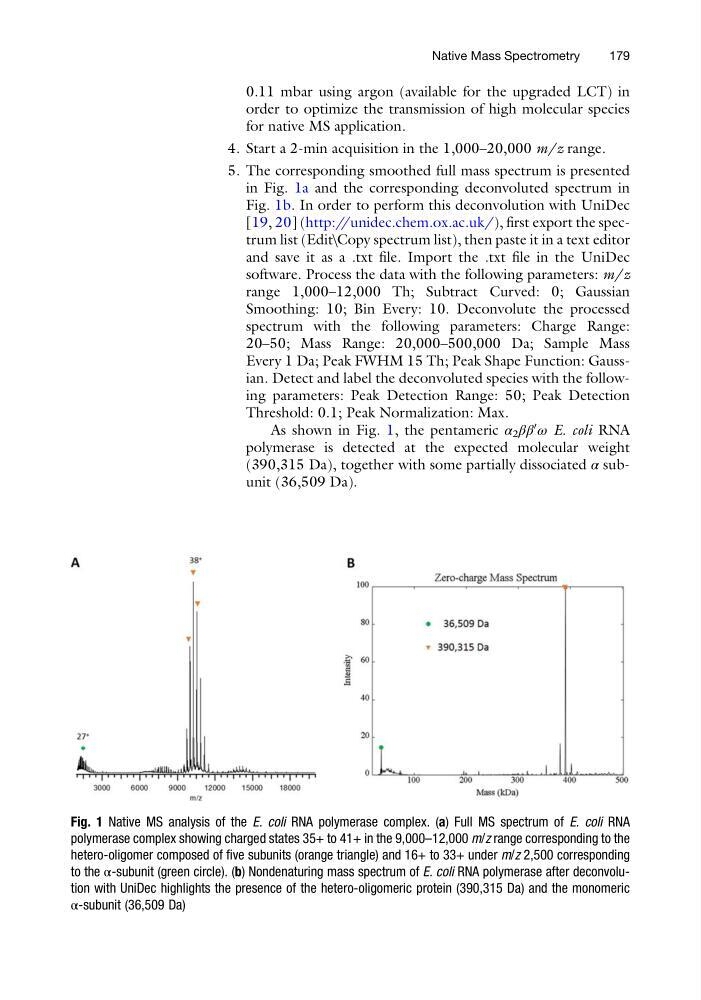
5. The corresponding smoothed full mass spectrum is presented
in Fig. 1a and the corresponding deconvoluted spectrum in
Fig. 1b. In order to perform this deconvolution with UniDec
[19, 20] (http://unidec.chem.ox.ac.uk/), first export the spectrum list (Edit\Copy spectrum list), then paste it in a text editor
and save it as a .txt file. Import the .txt file in the UniDec
software. Process the data with the following parameters: m/z
range 1,000–12,000 Th; Subtract Curved: 0; Gaussian
Smoothing: 10; Bin Every: 10. Deconvolute the processed
spectrum with the following parameters: Charge Range:
20–50; Mass Range: 20,000–500,000 Da; Sample Mass
Every 1 Da; Peak FWHM 15 Th; Peak Shape Function: Gaussian. Detect and label the deconvoluted species with the following parameters: Peak Detection Range: 50; Peak Detection
Threshold: 0.1; Peak Normalization: Max.
As shown in Fig. 1, the pentameric α 2 ββ
0
ω E. coli RNA
polymerase is detected at the expected molecular weight
(390,315 Da), together with some partially dissociated α subunit (36,509 Da).
Fig. 1 Native MS analysis of the E. coli RNA polymerase complex. (a) Full MS spectrum of E. coli RNA
polymerase complex showing charged states 35+ to 41+ in the 9,000–12,000 m/z range corresponding to the
hetero-oligomer composed of five subunits (orange triangle) and 16+ to 33+ under m/z 2,500 corresponding
to the α-subunit (green circle). (b) Nondenaturing mass spectrum of E. coli RNA polymerase after deconvolution with UniDec highlights the presence of the hetero-oligomeric protein (390,315 Da) and the monomeric
α-subunit (36,509 Da)
Native Mass Spectrometry
179
order to optimize the transmission of high molecular species
for native MS application.
4. Start a 2-min acquisition in the 1,000–20,000 m/z range.
5. The corresponding smoothed full mass spectrum is presented
in Fig. 1a and the corresponding deconvoluted spectrum in
Fig. 1b. In order to perform this deconvolution with UniDec
[19, 20] (http://unidec.chem.ox.ac.uk/), first export the spectrum list (Edit\Copy spectrum list), then paste it in a text editor
and save it as a .txt file. Import the .txt file in the UniDec
software. Process the data with the following parameters: m/z
range 1,000–12,000 Th; Subtract Curved: 0; Gaussian
Smoothing: 10; Bin Every: 10. Deconvolute the processed
spectrum with the following parameters: Charge Range:
20–50; Mass Range: 20,000–500,000 Da; Sample Mass
Every 1 Da; Peak FWHM 15 Th; Peak Shape Function: Gaussian. Detect and label the deconvoluted species with the following parameters: Peak Detection Range: 50; Peak Detection
Threshold: 0.1; Peak Normalization: Max.
As shown in Fig. 1, the pentameric α 2 ββ
0
ω E. coli RNA
polymerase is detected at the expected molecular weight
(390,315 Da), together with some partially dissociated α subunit (36,509 Da).
Fig. 1 Native MS analysis of the E. coli RNA polymerase complex. (a) Full MS spectrum of E. coli RNA
polymerase complex showing charged states 35+ to 41+ in the 9,000–12,000 m/z range corresponding to the
hetero-oligomer composed of five subunits (orange triangle) and 16+ to 33+ under m/z 2,500 corresponding
to the α-subunit (green circle). (b) Nondenaturing mass spectrum of E. coli RNA polymerase after deconvolution with UniDec highlights the presence of the hetero-oligomeric protein (390,315 Da) and the monomeric
α-subunit (36,509 Da)
Native Mass Spectrometry
179