

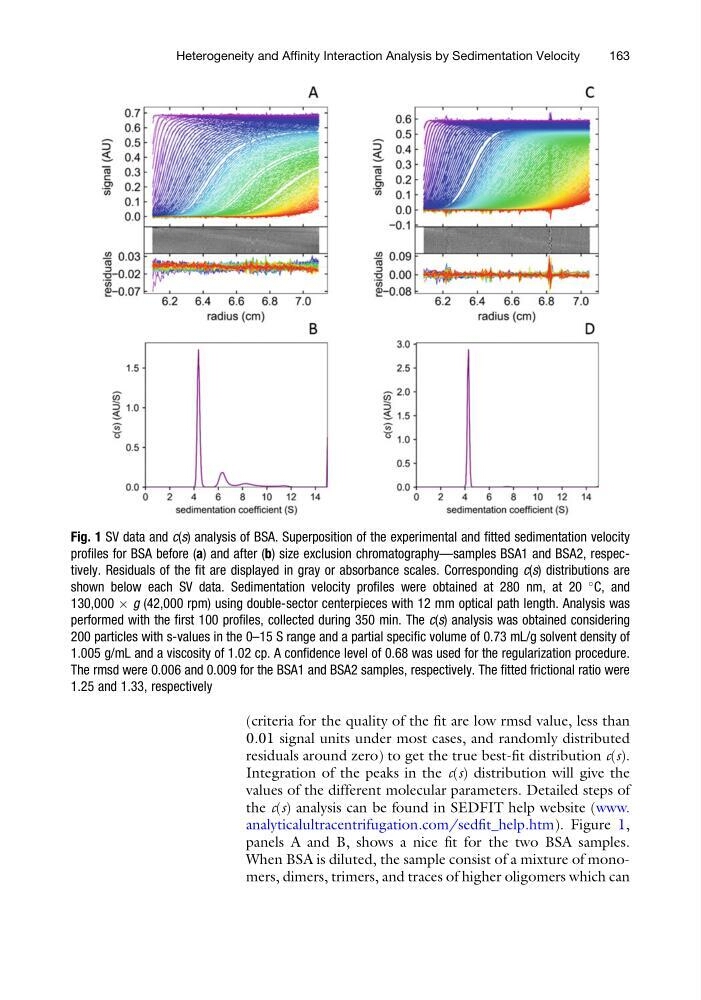
(criteria for the quality of the fit are low rmsd value, less than
0.01 signal units under most cases, and randomly distributed
residuals around zero) to get the true best-fit distribution c(s).
Integration of the peaks in the c(s) distribution will give the
values of the different molecular parameters. Detailed steps of
the c(s) analysis can be found in SEDFIT help website (www.
analyticalultracentrifugation.com/sedfit_help.htm). Figure 1,
panels A and B, shows a nice fit for the two BSA samples.
When BSA is diluted, the sample consist of a mixture of monomers, dimers, trimers, and traces of higher oligomers which can
Fig. 1 SV data and c(s) analysis of BSA. Superposition of the experimental and fitted sedimentation velocity
profiles for BSA before (a) and after (b) size exclusion chromatography—samples BSA1 and BSA2, respectively. Residuals of the fit are displayed in gray or absorbance scales. Corresponding c(s) distributions are
shown below each SV data. Sedimentation velocity profiles were obtained at 280 nm, at 20
C, and
130,000 Â g (42,000 rpm) using double-sector centerpieces with 12 mm optical path length. Analysis was
performed with the first 100 profiles, collected during 350 min. The c(s) analysis was obtained considering
200 particles with s-values in the 0–15 S range and a partial specific volume of 0.73 mL/g solvent density of
1.005 g/mL and a viscosity of 1.02 cp. A confidence level of 0.68 was used for the regularization procedure.
The rmsd were 0.006 and 0.009 for the BSA1 and BSA2 samples, respectively. The fitted frictional ratio were
1.25 and 1.33, respectively
Heterogeneity and Affinity Interaction Analysis by Sedimentation Velocity
163
0.01 signal units under most cases, and randomly distributed
residuals around zero) to get the true best-fit distribution c(s).
Integration of the peaks in the c(s) distribution will give the
values of the different molecular parameters. Detailed steps of
the c(s) analysis can be found in SEDFIT help website (www.
analyticalultracentrifugation.com/sedfit_help.htm). Figure 1,
panels A and B, shows a nice fit for the two BSA samples.
When BSA is diluted, the sample consist of a mixture of monomers, dimers, trimers, and traces of higher oligomers which can
Fig. 1 SV data and c(s) analysis of BSA. Superposition of the experimental and fitted sedimentation velocity
profiles for BSA before (a) and after (b) size exclusion chromatography—samples BSA1 and BSA2, respectively. Residuals of the fit are displayed in gray or absorbance scales. Corresponding c(s) distributions are
shown below each SV data. Sedimentation velocity profiles were obtained at 280 nm, at 20
C, and
130,000 Â g (42,000 rpm) using double-sector centerpieces with 12 mm optical path length. Analysis was
performed with the first 100 profiles, collected during 350 min. The c(s) analysis was obtained considering
200 particles with s-values in the 0–15 S range and a partial specific volume of 0.73 mL/g solvent density of
1.005 g/mL and a viscosity of 1.02 cp. A confidence level of 0.68 was used for the regularization procedure.
The rmsd were 0.006 and 0.009 for the BSA1 and BSA2 samples, respectively. The fitted frictional ratio were
1.25 and 1.33, respectively
Heterogeneity and Affinity Interaction Analysis by Sedimentation Velocity
163