

the capillary. The fluorescence curves (called MST traces) are
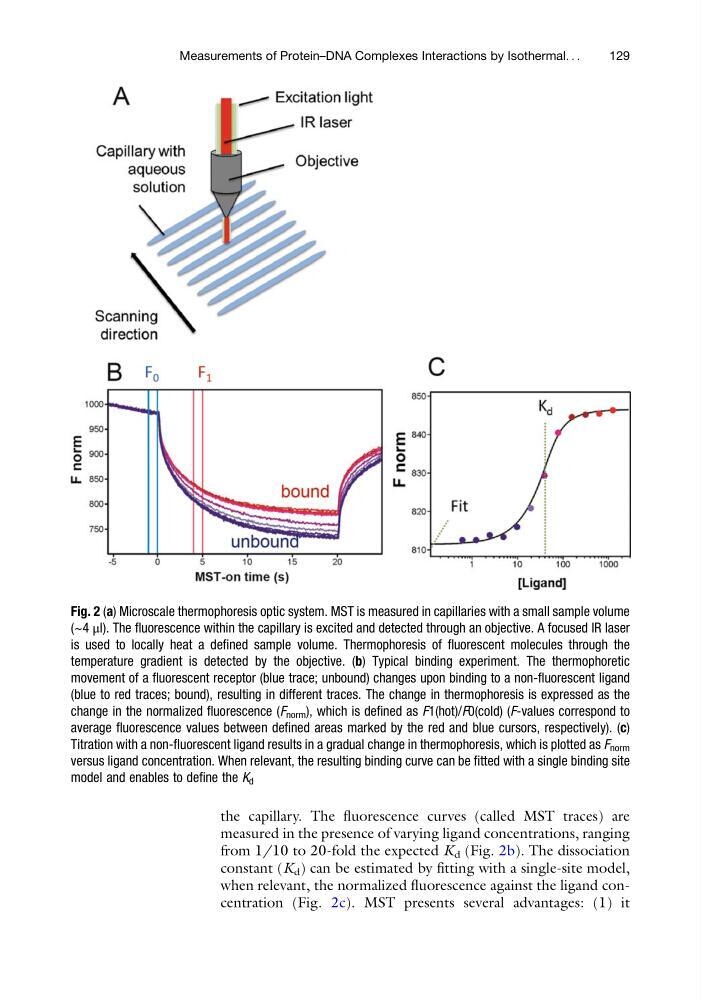
measured in the presence of varying ligand concentrations, ranging
from 1/10 to 20-fold the expected K d (Fig. 2b). The dissociation
constant (K d ) can be estimated by fitting with a single-site model,
when relevant, the normalized fluorescence against the ligand concentration (Fig. 2c). MST presents several advantages: (1) it
Fig. 2 (a) Microscale thermophoresis optic system. MST is measured in capillaries with a small sample volume
(~4 μl). The fluorescence within the capillary is excited and detected through an objective. A focused IR laser
is used to locally heat a defined sample volume. Thermophoresis of fluorescent molecules through the
temperature gradient is detected by the objective. (b) Typical binding experiment. The thermophoretic
movement of a fluorescent receptor (blue trace; unbound) changes upon binding to a non-fluorescent ligand
(blue to red traces; bound), resulting in different traces. The change in thermophoresis is expressed as the
change in the normalized fluorescence (F norm ), which is defined as F1(hot)/F0(cold) (F-values correspond to
average fluorescence values between defined areas marked by the red and blue cursors, respectively). (c)
Titration with a non-fluorescent ligand results in a gradual change in thermophoresis, which is plotted as F norm
versus ligand concentration. When relevant, the resulting binding curve can be fitted with a single binding site
model and enables to define the K d
Measurements of Protein–DNA Complexes Interactions by Isothermal. . .
129
measured in the presence of varying ligand concentrations, ranging
from 1/10 to 20-fold the expected K d (Fig. 2b). The dissociation
constant (K d ) can be estimated by fitting with a single-site model,
when relevant, the normalized fluorescence against the ligand concentration (Fig. 2c). MST presents several advantages: (1) it
Fig. 2 (a) Microscale thermophoresis optic system. MST is measured in capillaries with a small sample volume
(~4 μl). The fluorescence within the capillary is excited and detected through an objective. A focused IR laser
is used to locally heat a defined sample volume. Thermophoresis of fluorescent molecules through the
temperature gradient is detected by the objective. (b) Typical binding experiment. The thermophoretic
movement of a fluorescent receptor (blue trace; unbound) changes upon binding to a non-fluorescent ligand
(blue to red traces; bound), resulting in different traces. The change in thermophoresis is expressed as the
change in the normalized fluorescence (F norm ), which is defined as F1(hot)/F0(cold) (F-values correspond to
average fluorescence values between defined areas marked by the red and blue cursors, respectively). (c)
Titration with a non-fluorescent ligand results in a gradual change in thermophoresis, which is plotted as F norm
versus ligand concentration. When relevant, the resulting binding curve can be fitted with a single binding site
model and enables to define the K d
Measurements of Protein–DNA Complexes Interactions by Isothermal. . .
129