

of protein and DNA in particular for K d in the μM range; (2) it is
difficult to measure K d below nanomolar range though under
nanomolar range displacement titration can be done [18].
Microscale thermophoresis (MST) is a more recent approach
for measuring the affinity constant (K d ) between a receptor and a
ligand [19, 20]. This method can use either the intrinsic fluorescence of the protein (for example Monolith NT.LabelFree, Nanotemper) or the fluorescence signal (for example Monolith NT.115,
Nanotemper) of a probe linked to the receptor or to the ligand. A
temperature gradient is applied overtime by an IR (infra-red) laser
on a capillary containing the fluorescent receptor alone or with
increasing concentration of the ligand (Fig. 2a). The laser generates
a local heat on the capillary inducing the diffusion of the fluorescent
receptor away from the irradiated zone. The laser is turned off and
the receptor diffuses again to the depleted zone. The diffusion rate
of the receptor is highly sensitive to its hydration state. The formation of the receptor–ligand complex modifies locally the hydration,
the size, and the charge of the receptor that can lead to detectable
variation on the diffusion of the fluorescently labeled receptor in
Time (min)
0 20 40 60 80 100
0.00
-0.05
-0.10
-0.15
0.00
-3.00
-7.00
-10.00
ΔT
AdiabaƟc
shield
Reference cell
Measurement cell
(V = 1,4 mL)
Syringe
(V = 300 μL)
K a
n
0 0.5 1.0 1.5 2.0 2.5
Molar raƟo
ΔH
A
B
μcal/sec
kcal.mol
-1
of
injectant
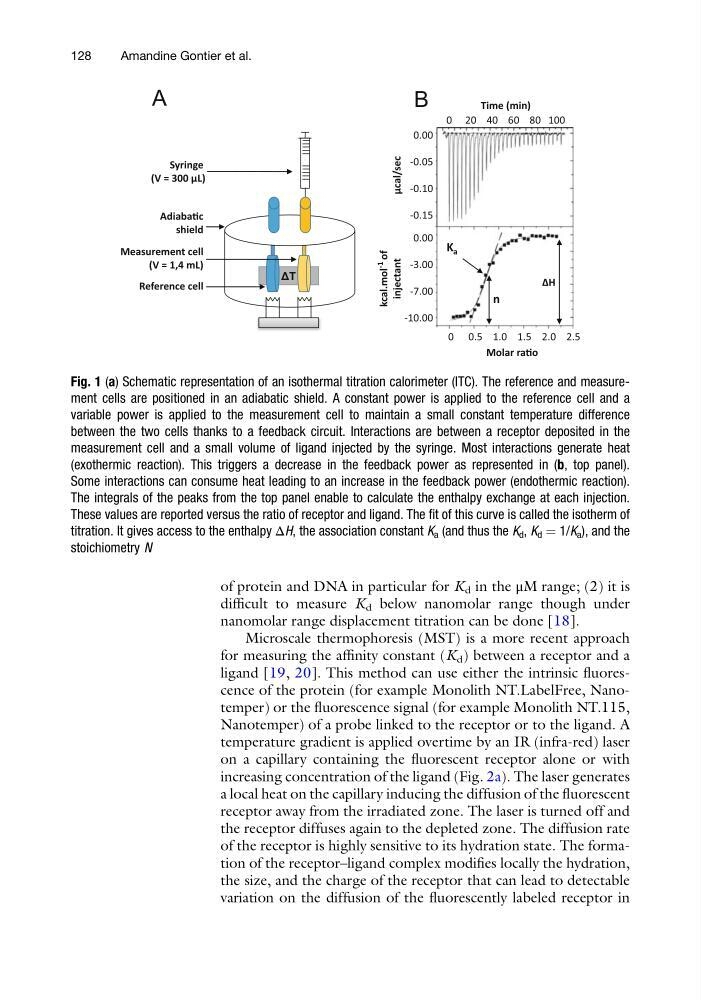
Fig. 1 (a) Schematic representation of an isothermal titration calorimeter (ITC). The reference and measurement cells are positioned in an adiabatic shield. A constant power is applied to the reference cell and a
variable power is applied to the measurement cell to maintain a small constant temperature difference
between the two cells thanks to a feedback circuit. Interactions are between a receptor deposited in the
measurement cell and a small volume of ligand injected by the syringe. Most interactions generate heat
(exothermic reaction). This triggers a decrease in the feedback power as represented in (b, top panel).
Some interactions can consume heat leading to an increase in the feedback power (endothermic reaction).
The integrals of the peaks from the top panel enable to calculate the enthalpy exchange at each injection.
These values are reported versus the ratio of receptor and ligand. The fit of this curve is called the isotherm of
titration. It gives access to the enthalpy ΔH, the association constant K a (and thus the K d , K d ¼ 1/K a ), and the
stoichiometry N
128
Amandine Gontier et al.
difficult to measure K d below nanomolar range though under
nanomolar range displacement titration can be done [18].
Microscale thermophoresis (MST) is a more recent approach
for measuring the affinity constant (K d ) between a receptor and a
ligand [19, 20]. This method can use either the intrinsic fluorescence of the protein (for example Monolith NT.LabelFree, Nanotemper) or the fluorescence signal (for example Monolith NT.115,
Nanotemper) of a probe linked to the receptor or to the ligand. A
temperature gradient is applied overtime by an IR (infra-red) laser
on a capillary containing the fluorescent receptor alone or with
increasing concentration of the ligand (Fig. 2a). The laser generates
a local heat on the capillary inducing the diffusion of the fluorescent
receptor away from the irradiated zone. The laser is turned off and
the receptor diffuses again to the depleted zone. The diffusion rate
of the receptor is highly sensitive to its hydration state. The formation of the receptor–ligand complex modifies locally the hydration,
the size, and the charge of the receptor that can lead to detectable
variation on the diffusion of the fluorescently labeled receptor in
Time (min)
0 20 40 60 80 100
0.00
-0.05
-0.10
-0.15
0.00
-3.00
-7.00
-10.00
ΔT
AdiabaƟc
shield
Reference cell
Measurement cell
(V = 1,4 mL)
Syringe
(V = 300 μL)
K a
n
0 0.5 1.0 1.5 2.0 2.5
Molar raƟo
ΔH
A
B
μcal/sec
kcal.mol
-1
of
injectant
Fig. 1 (a) Schematic representation of an isothermal titration calorimeter (ITC). The reference and measurement cells are positioned in an adiabatic shield. A constant power is applied to the reference cell and a
variable power is applied to the measurement cell to maintain a small constant temperature difference
between the two cells thanks to a feedback circuit. Interactions are between a receptor deposited in the
measurement cell and a small volume of ligand injected by the syringe. Most interactions generate heat
(exothermic reaction). This triggers a decrease in the feedback power as represented in (b, top panel).
Some interactions can consume heat leading to an increase in the feedback power (endothermic reaction).
The integrals of the peaks from the top panel enable to calculate the enthalpy exchange at each injection.
These values are reported versus the ratio of receptor and ligand. The fit of this curve is called the isotherm of
titration. It gives access to the enthalpy ΔH, the association constant K a (and thus the K d , K d ¼ 1/K a ), and the
stoichiometry N
128
Amandine Gontier et al.