

2 Influence of Controlled Breathing (Pranayama) on Dermal Perfusion
47
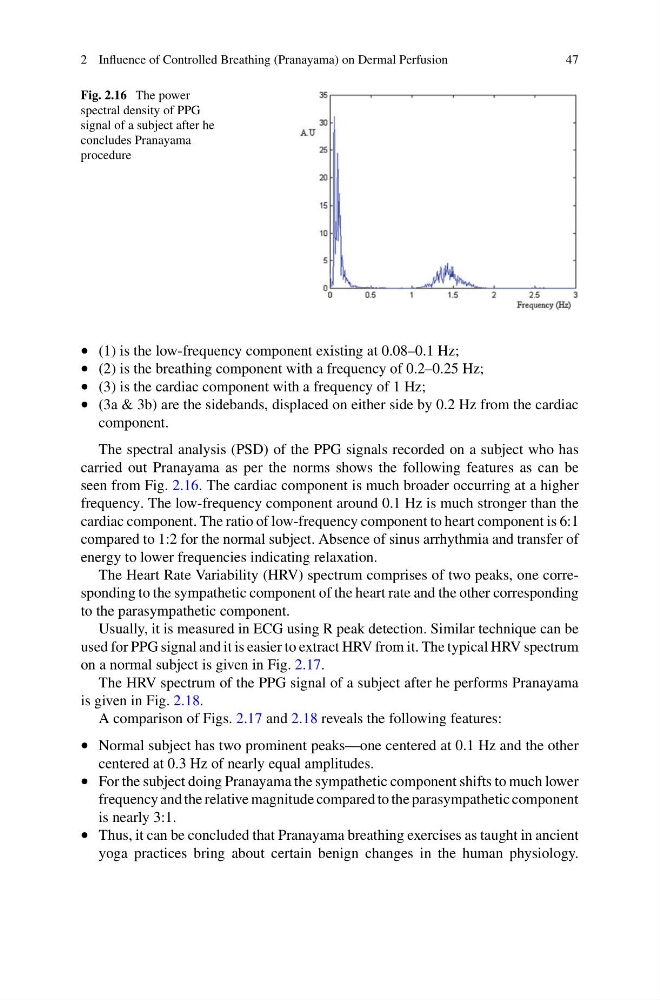
Fig. 2.16 The power
spectral density of PPG
signal of a subject after he
concludes Pranayama
procedure
• (1) is the low-frequency component existing at 0.08–0.1 Hz;
• (2) is the breathing component with a frequency of 0.2–0.25 Hz;
• (3) is the cardiac component with a frequency of 1 Hz;
• (3a & 3b) are the sidebands, displaced on either side by 0.2 Hz from the cardiac
component.
The spectral analysis (PSD) of the PPG signals recorded on a subject who has
carried out Pranayama as per the norms shows the following features as can be
seen from Fig. 2.16. The cardiac component is much broader occurring at a higher
frequency. The low-frequency component around 0.1 Hz is much stronger than the
cardiac component. The ratio of low-frequency component to heart component is 6:1
compared to 1:2 for the normal subject. Absence of sinus arrhythmia and transfer of
energy to lower frequencies indicating relaxation.
The Heart Rate Variability (HRV) spectrum comprises of two peaks, one corresponding to the sympathetic component of the heart rate and the other corresponding
to the parasympathetic component.
Usually, it is measured in ECG using R peak detection. Similar technique can be
used for PPG signal and it is easier to extract HRV from it. The typical HRV spectrum
on a normal subject is given in Fig. 2.17.
The HRV spectrum of the PPG signal of a subject after he performs Pranayama
is given in Fig. 2.18.
A comparison of Figs. 2.17 and 2.18 reveals the following features:
• Normal subject has two prominent peaks—one centered at 0.1 Hz and the other
centered at 0.3 Hz of nearly equal amplitudes.
• For the subject doing Pranayama the sympathetic component shifts to much lower
frequency and the relative magnitude compared to the parasympathetic component
is nearly 3:1.
• Thus, it can be concluded that Pranayama breathing exercises as taught in ancient
yoga practices bring about certain benign changes in the human physiology.
47
Fig. 2.16 The power
spectral density of PPG
signal of a subject after he
concludes Pranayama
procedure
• (1) is the low-frequency component existing at 0.08–0.1 Hz;
• (2) is the breathing component with a frequency of 0.2–0.25 Hz;
• (3) is the cardiac component with a frequency of 1 Hz;
• (3a & 3b) are the sidebands, displaced on either side by 0.2 Hz from the cardiac
component.
The spectral analysis (PSD) of the PPG signals recorded on a subject who has
carried out Pranayama as per the norms shows the following features as can be
seen from Fig. 2.16. The cardiac component is much broader occurring at a higher
frequency. The low-frequency component around 0.1 Hz is much stronger than the
cardiac component. The ratio of low-frequency component to heart component is 6:1
compared to 1:2 for the normal subject. Absence of sinus arrhythmia and transfer of
energy to lower frequencies indicating relaxation.
The Heart Rate Variability (HRV) spectrum comprises of two peaks, one corresponding to the sympathetic component of the heart rate and the other corresponding
to the parasympathetic component.
Usually, it is measured in ECG using R peak detection. Similar technique can be
used for PPG signal and it is easier to extract HRV from it. The typical HRV spectrum
on a normal subject is given in Fig. 2.17.
The HRV spectrum of the PPG signal of a subject after he performs Pranayama
is given in Fig. 2.18.
A comparison of Figs. 2.17 and 2.18 reveals the following features:
• Normal subject has two prominent peaks—one centered at 0.1 Hz and the other
centered at 0.3 Hz of nearly equal amplitudes.
• For the subject doing Pranayama the sympathetic component shifts to much lower
frequency and the relative magnitude compared to the parasympathetic component
is nearly 3:1.
• Thus, it can be concluded that Pranayama breathing exercises as taught in ancient
yoga practices bring about certain benign changes in the human physiology.