

18
V. Blazek
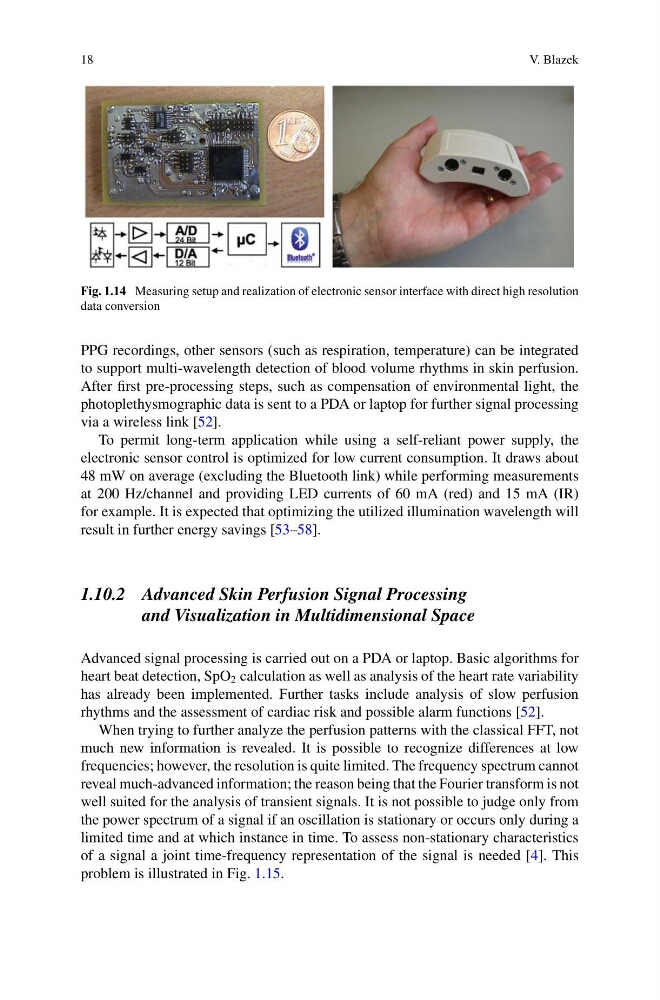
Fig. 1.14 Measuring setup and realization of electronic sensor interface with direct high resolution
data conversion
PPG recordings, other sensors (such as respiration, temperature) can be integrated
to support multi-wavelength detection of blood volume rhythms in skin perfusion.
After first pre-processing steps, such as compensation of environmental light, the
photoplethysmographic data is sent to a PDA or laptop for further signal processing
via a wireless link [52].
To permit long-term application while using a self-reliant power supply, the
electronic sensor control is optimized for low current consumption. It draws about
48 mW on average (excluding the Bluetooth link) while performing measurements
at 200 Hz/channel and providing LED currents of 60 mA (red) and 15 mA (IR)
for example. It is expected that optimizing the utilized illumination wavelength will
result in further energy savings [53–58].
1.10.2 Advanced Skin Perfusion Signal Processing
and Visualization in Multidimensional Space
Advanced signal processing is carried out on a PDA or laptop. Basic algorithms for
heart beat detection, SpO 2 calculation as well as analysis of the heart rate variability
has already been implemented. Further tasks include analysis of slow perfusion
rhythms and the assessment of cardiac risk and possible alarm functions [52].
When trying to further analyze the perfusion patterns with the classical FFT, not
much new information is revealed. It is possible to recognize differences at low
frequencies; however, the resolution is quite limited. The frequency spectrum cannot
reveal much-advanced information; the reason being that the Fourier transform is not
well suited for the analysis of transient signals. It is not possible to judge only from
the power spectrum of a signal if an oscillation is stationary or occurs only during a
limited time and at which instance in time. To assess non-stationary characteristics
of a signal a joint time-frequency representation of the signal is needed [4]. This
problem is illustrated in Fig. 1.15.
V. Blazek
Fig. 1.14 Measuring setup and realization of electronic sensor interface with direct high resolution
data conversion
PPG recordings, other sensors (such as respiration, temperature) can be integrated
to support multi-wavelength detection of blood volume rhythms in skin perfusion.
After first pre-processing steps, such as compensation of environmental light, the
photoplethysmographic data is sent to a PDA or laptop for further signal processing
via a wireless link [52].
To permit long-term application while using a self-reliant power supply, the
electronic sensor control is optimized for low current consumption. It draws about
48 mW on average (excluding the Bluetooth link) while performing measurements
at 200 Hz/channel and providing LED currents of 60 mA (red) and 15 mA (IR)
for example. It is expected that optimizing the utilized illumination wavelength will
result in further energy savings [53–58].
1.10.2 Advanced Skin Perfusion Signal Processing
and Visualization in Multidimensional Space
Advanced signal processing is carried out on a PDA or laptop. Basic algorithms for
heart beat detection, SpO 2 calculation as well as analysis of the heart rate variability
has already been implemented. Further tasks include analysis of slow perfusion
rhythms and the assessment of cardiac risk and possible alarm functions [52].
When trying to further analyze the perfusion patterns with the classical FFT, not
much new information is revealed. It is possible to recognize differences at low
frequencies; however, the resolution is quite limited. The frequency spectrum cannot
reveal much-advanced information; the reason being that the Fourier transform is not
well suited for the analysis of transient signals. It is not possible to judge only from
the power spectrum of a signal if an oscillation is stationary or occurs only during a
limited time and at which instance in time. To assess non-stationary characteristics
of a signal a joint time-frequency representation of the signal is needed [4]. This
problem is illustrated in Fig. 1.15.