

172
M. Hülsbusch and V. Blazek
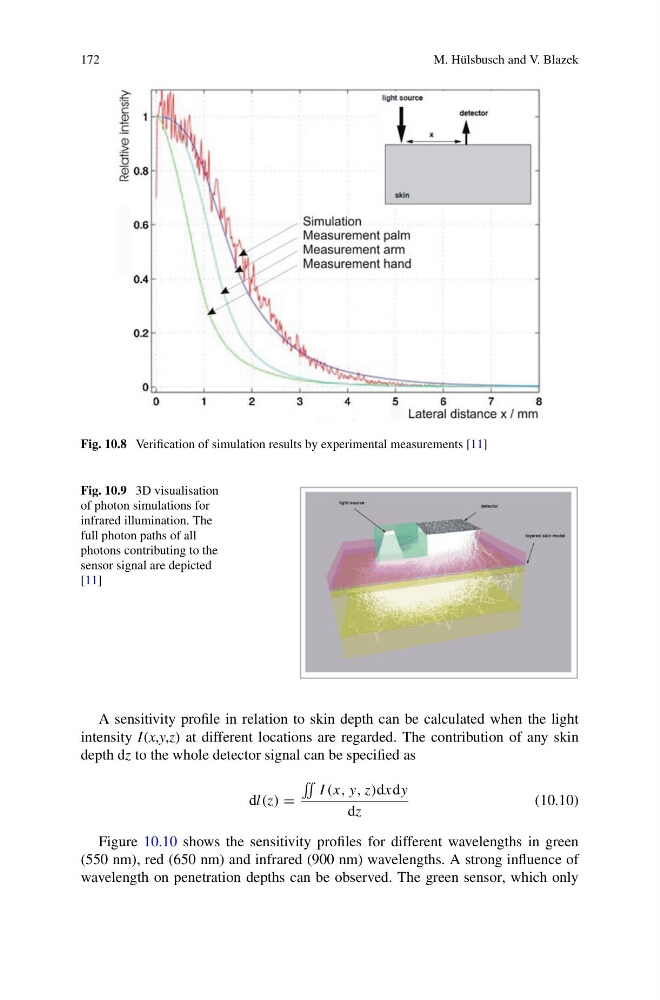
Fig. 10.8 Verification of simulation results by experimental measurements [11]
Fig. 10.9 3D visualisation
of photon simulations for
infrared illumination. The
full photon paths of all
photons contributing to the
sensor signal are depicted
[11]
A sensitivity profile in relation to skin depth can be calculated when the light
intensity I(x,y,z) at different locations are regarded. The contribution of any skin
depth dz to the whole detector signal can be specified as
dl(z) =
˜
I (x, y, z)dxdy
dz
(10.10)
Figure 10.10 shows the sensitivity profiles for different wavelengths in green
(550 nm), red (650 nm) and infrared (900 nm) wavelengths. A strong influence of
wavelength on penetration depths can be observed. The green sensor, which only
M. Hülsbusch and V. Blazek
Fig. 10.8 Verification of simulation results by experimental measurements [11]
Fig. 10.9 3D visualisation
of photon simulations for
infrared illumination. The
full photon paths of all
photons contributing to the
sensor signal are depicted
[11]
A sensitivity profile in relation to skin depth can be calculated when the light
intensity I(x,y,z) at different locations are regarded. The contribution of any skin
depth dz to the whole detector signal can be specified as
dl(z) =
˜
I (x, y, z)dxdy
dz
(10.10)
Figure 10.10 shows the sensitivity profiles for different wavelengths in green
(550 nm), red (650 nm) and infrared (900 nm) wavelengths. A strong influence of
wavelength on penetration depths can be observed. The green sensor, which only