

106
H. J. Schmitt
6.1 Characteristics of the Low-F Response
Through recent years hundreds if not thousands of recordings of blood flow variations
have been made in various centres, on various positions of the body, and under
different environmental and exercise conditions. Usually, perfusion is recorded in
the time domain and subsequently Fourier-transformed for spectral representation.
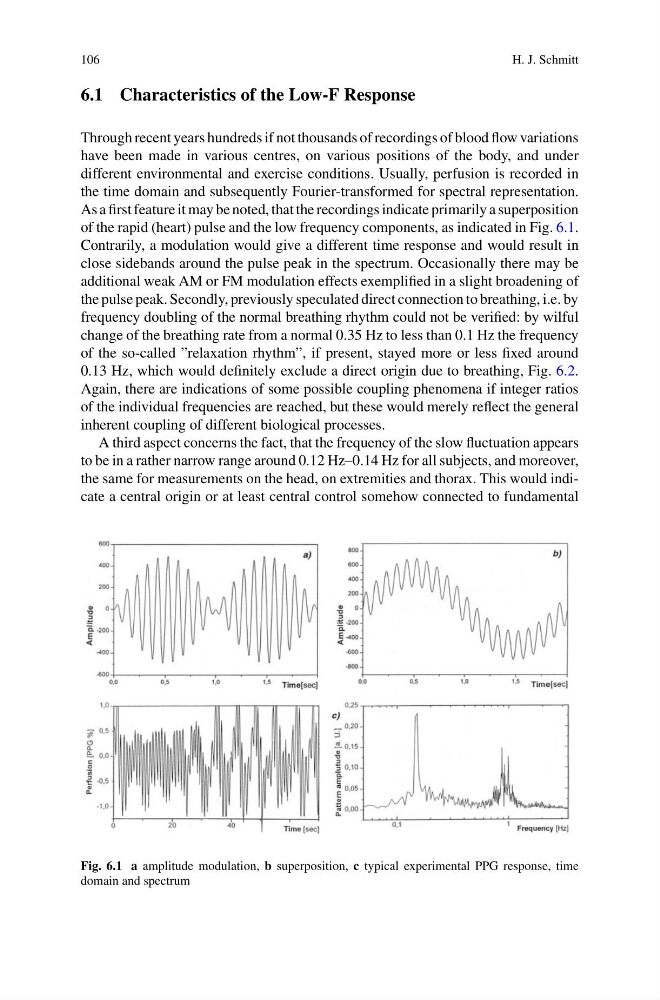
As a first feature it may be noted, that the recordings indicate primarily a superposition
of the rapid (heart) pulse and the low frequency components, as indicated in Fig. 6.1.
Contrarily, a modulation would give a different time response and would result in
close sidebands around the pulse peak in the spectrum. Occasionally there may be
additional weak AM or FM modulation effects exemplified in a slight broadening of
the pulse peak. Secondly, previously speculated direct connection to breathing, i.e. by
frequency doubling of the normal breathing rhythm could not be verified: by wilful
change of the breathing rate from a normal 0.35 Hz to less than 0.1 Hz the frequency
of the so-called ”relaxation rhythm”, if present, stayed more or less fixed around
0.13 Hz, which would definitely exclude a direct origin due to breathing, Fig. 6.2.
Again, there are indications of some possible coupling phenomena if integer ratios
of the individual frequencies are reached, but these would merely reflect the general
inherent coupling of different biological processes.
A third aspect concerns the fact, that the frequency of the slow fluctuation appears
to be in a rather narrow range around 0.12 Hz–0.14 Hz for all subjects, and moreover,
the same for measurements on the head, on extremities and thorax. This would indicate a central origin or at least central control somehow connected to fundamental
Fig. 6.1 a amplitude modulation, b superposition, c typical experimental PPG response, time
domain and spectrum
H. J. Schmitt
6.1 Characteristics of the Low-F Response
Through recent years hundreds if not thousands of recordings of blood flow variations
have been made in various centres, on various positions of the body, and under
different environmental and exercise conditions. Usually, perfusion is recorded in
the time domain and subsequently Fourier-transformed for spectral representation.
As a first feature it may be noted, that the recordings indicate primarily a superposition
of the rapid (heart) pulse and the low frequency components, as indicated in Fig. 6.1.
Contrarily, a modulation would give a different time response and would result in
close sidebands around the pulse peak in the spectrum. Occasionally there may be
additional weak AM or FM modulation effects exemplified in a slight broadening of
the pulse peak. Secondly, previously speculated direct connection to breathing, i.e. by
frequency doubling of the normal breathing rhythm could not be verified: by wilful
change of the breathing rate from a normal 0.35 Hz to less than 0.1 Hz the frequency
of the so-called ”relaxation rhythm”, if present, stayed more or less fixed around
0.13 Hz, which would definitely exclude a direct origin due to breathing, Fig. 6.2.
Again, there are indications of some possible coupling phenomena if integer ratios
of the individual frequencies are reached, but these would merely reflect the general
inherent coupling of different biological processes.
A third aspect concerns the fact, that the frequency of the slow fluctuation appears
to be in a rather narrow range around 0.12 Hz–0.14 Hz for all subjects, and moreover,
the same for measurements on the head, on extremities and thorax. This would indicate a central origin or at least central control somehow connected to fundamental
Fig. 6.1 a amplitude modulation, b superposition, c typical experimental PPG response, time
domain and spectrum