

5 Peripheral Venous Dynamics, Venous Oxygen Saturation …
101
Fig. 5.6 Typical perfusion signals (with arterial and venous signal components), measured at two
different wavelengths. Representation of the “arterial pulse (AP)” and “venous pulse (VP)” DC and
AC signal components for muscle pump test signals from Fig. 5.5. The venous DC to AC difference
namely during the active leg exercise; consequently, only in this leg exercise time sequence, the
value of the venous oxygen saturation (SvO 2 ) can be calculated. Rv (from venous pulse) and Ra
(from arterial pulse) are the normalized red to infrared ratios for this purpose
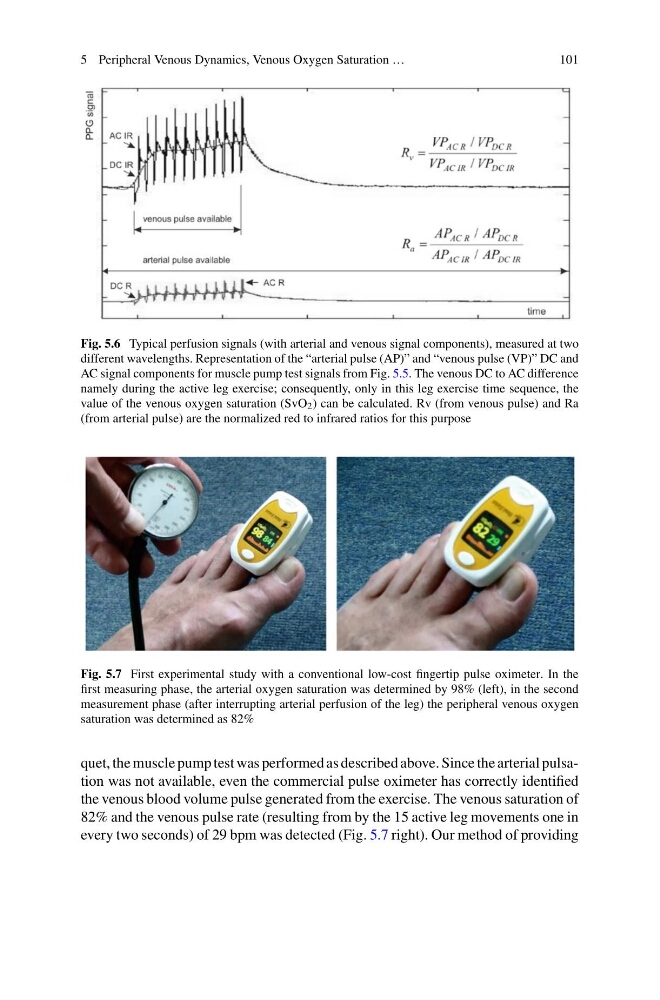
Fig. 5.7 First experimental study with a conventional low-cost fingertip pulse oximeter. In the
first measuring phase, the arterial oxygen saturation was determined by 98% (left), in the second
measurement phase (after interrupting arterial perfusion of the leg) the peripheral venous oxygen
saturation was determined as 82%
quet, the muscle pump test was performed as described above. Since the arterial pulsation was not available, even the commercial pulse oximeter has correctly identified
the venous blood volume pulse generated from the exercise. The venous saturation of
82% and the venous pulse rate (resulting from by the 15 active leg movements one in
every two seconds) of 29 bpm was detected (Fig. 5.7 right). Our method of providing
101
Fig. 5.6 Typical perfusion signals (with arterial and venous signal components), measured at two
different wavelengths. Representation of the “arterial pulse (AP)” and “venous pulse (VP)” DC and
AC signal components for muscle pump test signals from Fig. 5.5. The venous DC to AC difference
namely during the active leg exercise; consequently, only in this leg exercise time sequence, the
value of the venous oxygen saturation (SvO 2 ) can be calculated. Rv (from venous pulse) and Ra
(from arterial pulse) are the normalized red to infrared ratios for this purpose
Fig. 5.7 First experimental study with a conventional low-cost fingertip pulse oximeter. In the
first measuring phase, the arterial oxygen saturation was determined by 98% (left), in the second
measurement phase (after interrupting arterial perfusion of the leg) the peripheral venous oxygen
saturation was determined as 82%
quet, the muscle pump test was performed as described above. Since the arterial pulsation was not available, even the commercial pulse oximeter has correctly identified
the venous blood volume pulse generated from the exercise. The venous saturation of
82% and the venous pulse rate (resulting from by the 15 active leg movements one in
every two seconds) of 29 bpm was detected (Fig. 5.7 right). Our method of providing