

64
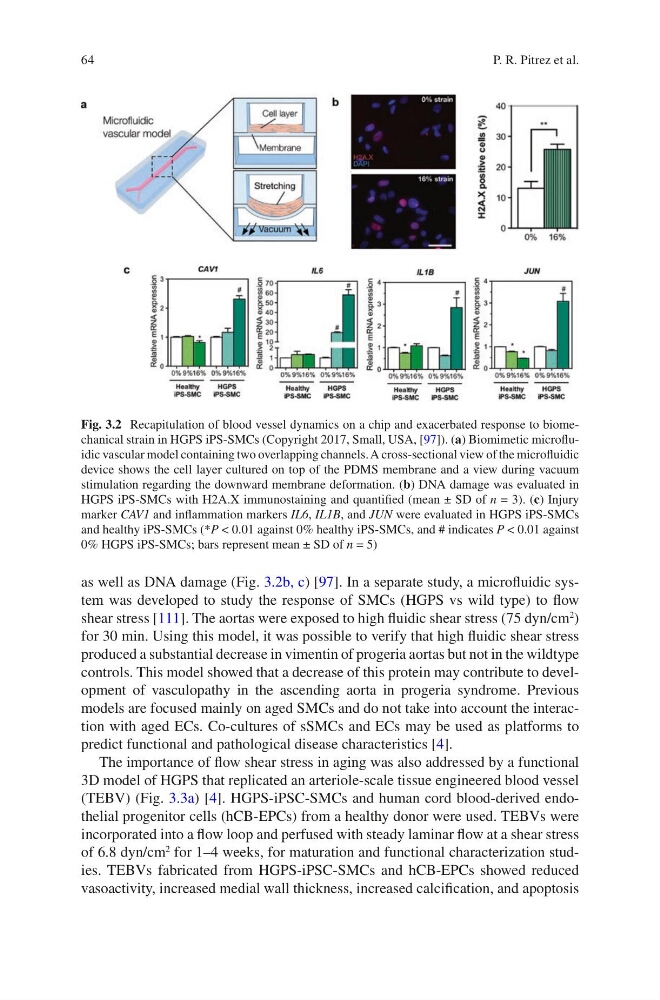
as well as DNA damage (Fig. 3.2b, c) [97]. In a separate study, a microfluidic system was developed to study the response of SMCs (HGPS vs wild type) to flow
shear stress [111]. The aortas were exposed to high fluidic shear stress (75 dyn/cm
2
)
for 30 min. Using this model, it was possible to verify that high fluidic shear stress
produced a substantial decrease in vimentin of progeria aortas but not in the wildtype
controls. This model showed that a decrease of this protein may contribute to development of vasculopathy in the ascending aorta in progeria syndrome. Previous
models are focused mainly on aged SMCs and do not take into account the interaction with aged ECs. Co-cultures of sSMCs and ECs may be used as platforms to
predict functional and pathological disease characteristics [4].
The importance of flow shear stress in aging was also addressed by a functional
3D model of HGPS that replicated an arteriole-scale tissue engineered blood vessel
(TEBV) (Fig. 3.3a) [4]. HGPS-iPSC-SMCs and human cord blood-derived endothelial progenitor cells (hCB-EPCs) from a healthy donor were used. TEBVs were
incorporated into a flow loop and perfused with steady laminar flow at a shear stress
of 6.8 dyn/cm
2
for 1–4 weeks, for maturation and functional characterization studies. TEBVs fabricated from HGPS-iPSC-SMCs and hCB-EPCs showed reduced
vasoactivity, increased medial wall thickness, increased calcification, and apoptosis
Fig. 3.2 Recapitulation of blood vessel dynamics on a chip and exacerbated response to biomechanical strain in HGPS iPS-SMCs (Copyright 2017, Small, USA, [97]). (a) Biomimetic microfluidic vascular model containing two overlapping channels. A cross-sectional view of the microfluidic
device shows the cell layer cultured on top of the PDMS membrane and a view during vacuum
stimulation regarding the downward membrane deformation. (b) DNA damage was evaluated in
HGPS iPS-SMCs with H2A.X immunostaining and quantified (mean ± SD of n = 3). (c) Injury
marker CAV1 and inflammation markers IL6, IL1B, and JUN were evaluated in HGPS iPS-SMCs
and healthy iPS-SMCs (*P < 0.01 against 0% healthy iPS-SMCs, and # indicates P < 0.01 against
0% HGPS iPS-SMCs; bars represent mean ± SD of n = 5)
P. R. Pitrez et al.
as well as DNA damage (Fig. 3.2b, c) [97]. In a separate study, a microfluidic system was developed to study the response of SMCs (HGPS vs wild type) to flow
shear stress [111]. The aortas were exposed to high fluidic shear stress (75 dyn/cm
2
)
for 30 min. Using this model, it was possible to verify that high fluidic shear stress
produced a substantial decrease in vimentin of progeria aortas but not in the wildtype
controls. This model showed that a decrease of this protein may contribute to development of vasculopathy in the ascending aorta in progeria syndrome. Previous
models are focused mainly on aged SMCs and do not take into account the interaction with aged ECs. Co-cultures of sSMCs and ECs may be used as platforms to
predict functional and pathological disease characteristics [4].
The importance of flow shear stress in aging was also addressed by a functional
3D model of HGPS that replicated an arteriole-scale tissue engineered blood vessel
(TEBV) (Fig. 3.3a) [4]. HGPS-iPSC-SMCs and human cord blood-derived endothelial progenitor cells (hCB-EPCs) from a healthy donor were used. TEBVs were
incorporated into a flow loop and perfused with steady laminar flow at a shear stress
of 6.8 dyn/cm
2
for 1–4 weeks, for maturation and functional characterization studies. TEBVs fabricated from HGPS-iPSC-SMCs and hCB-EPCs showed reduced
vasoactivity, increased medial wall thickness, increased calcification, and apoptosis
Fig. 3.2 Recapitulation of blood vessel dynamics on a chip and exacerbated response to biomechanical strain in HGPS iPS-SMCs (Copyright 2017, Small, USA, [97]). (a) Biomimetic microfluidic vascular model containing two overlapping channels. A cross-sectional view of the microfluidic
device shows the cell layer cultured on top of the PDMS membrane and a view during vacuum
stimulation regarding the downward membrane deformation. (b) DNA damage was evaluated in
HGPS iPS-SMCs with H2A.X immunostaining and quantified (mean ± SD of n = 3). (c) Injury
marker CAV1 and inflammation markers IL6, IL1B, and JUN were evaluated in HGPS iPS-SMCs
and healthy iPS-SMCs (*P < 0.01 against 0% healthy iPS-SMCs, and # indicates P < 0.01 against
0% HGPS iPS-SMCs; bars represent mean ± SD of n = 5)
P. R. Pitrez et al.