

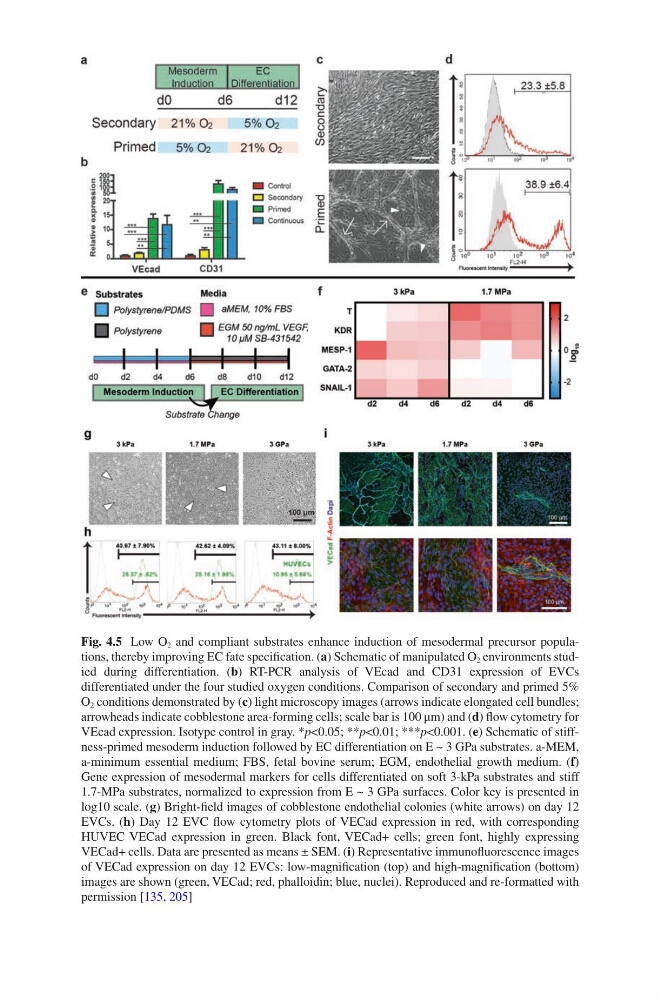
Fig. 4.5 Low O 2 and compliant substrates enhance induction of mesodermal precursor populations, thereby improving EC fate specification. (a) Schematic of manipulated O 2 environments studied during differentiation. (b) RT-PCR analysis of VEcad and CD31 expression of EVCs
differentiated under the four studied oxygen conditions. Comparison of secondary and primed 5%
O 2 conditions demonstrated by (c) light microscopy images (arrows indicate elongated cell bundles;
arrowheads indicate cobblestone area-forming cells; scale bar is 100 μm) and (d) flow cytometry for
VEcad expression. Isotype control in gray. *p<0.05; **p<0.01; ***p<0.001. (e) Schematic of stiffness-primed mesoderm induction followed by EC differentiation on E ~ 3 GPa substrates. a-MEM,
a-minimum essential medium; FBS, fetal bovine serum; EGM, endothelial growth medium. (f)
Gene expression of mesodermal markers for cells differentiated on soft 3-kPa substrates and stiff
1.7-MPa substrates, normalized to expression from E ~ 3 GPa surfaces. Color key is presented in
log10 scale. (g) Bright-field images of cobblestone endothelial colonies (white arrows) on day 12
EVCs. (h) Day 12 EVC flow cytometry plots of VECad expression in red, with corresponding
HUVEC VECad expression in green. Black font, VECad+ cells; green font, highly expressing
VECad+ cells. Data are presented as means ± SEM. (i) Representative immunofluorescence images
of VECad expression on day 12 EVCs: low-magnification (top) and high- magnification (bottom)
images are shown (green, VECad; red, phalloidin; blue, nuclei). Reproduced and re-formatted with
permission [135, 205]
differentiated under the four studied oxygen conditions. Comparison of secondary and primed 5%
O 2 conditions demonstrated by (c) light microscopy images (arrows indicate elongated cell bundles;
arrowheads indicate cobblestone area-forming cells; scale bar is 100 μm) and (d) flow cytometry for
VEcad expression. Isotype control in gray. *p<0.05; **p<0.01; ***p<0.001. (e) Schematic of stiffness-primed mesoderm induction followed by EC differentiation on E ~ 3 GPa substrates. a-MEM,
a-minimum essential medium; FBS, fetal bovine serum; EGM, endothelial growth medium. (f)
Gene expression of mesodermal markers for cells differentiated on soft 3-kPa substrates and stiff
1.7-MPa substrates, normalized to expression from E ~ 3 GPa surfaces. Color key is presented in
log10 scale. (g) Bright-field images of cobblestone endothelial colonies (white arrows) on day 12
EVCs. (h) Day 12 EVC flow cytometry plots of VECad expression in red, with corresponding
HUVEC VECad expression in green. Black font, VECad+ cells; green font, highly expressing
VECad+ cells. Data are presented as means ± SEM. (i) Representative immunofluorescence images
of VECad expression on day 12 EVCs: low-magnification (top) and high- magnification (bottom)
images are shown (green, VECad; red, phalloidin; blue, nuclei). Reproduced and re-formatted with
permission [135, 205]