

environment, without the need for cryo-microtomy or FIB milling. Recent results
demonstrating “live” STEM imaging of lightly-stained bacteria in a liquid cell [100]
were obtained with a DF detector. It would be interesting to see if BF imaging
would allow for observation of samples without addition of contrasting agents, and
if dynamic processes could be observed in the liquid environment [101].
Because of the ability to penetrate thicker areas, the use of correlative methods
based on fluorescent markers is sorely needed for CSTET. Specific areas of interest
can be difficult to identify when scanning thick cells, because of the superimposition of details in the projected images.
Other emerging techniques for obtaining 3D data on whole vitrified cells are
cryo X-ray tomography [96, 103, 104], and cryoFIB/SEM slice & view [105–107].
They both hold promise for wider FOV than CSTET could provide, but at the
expense of resolution compared to CSTET.
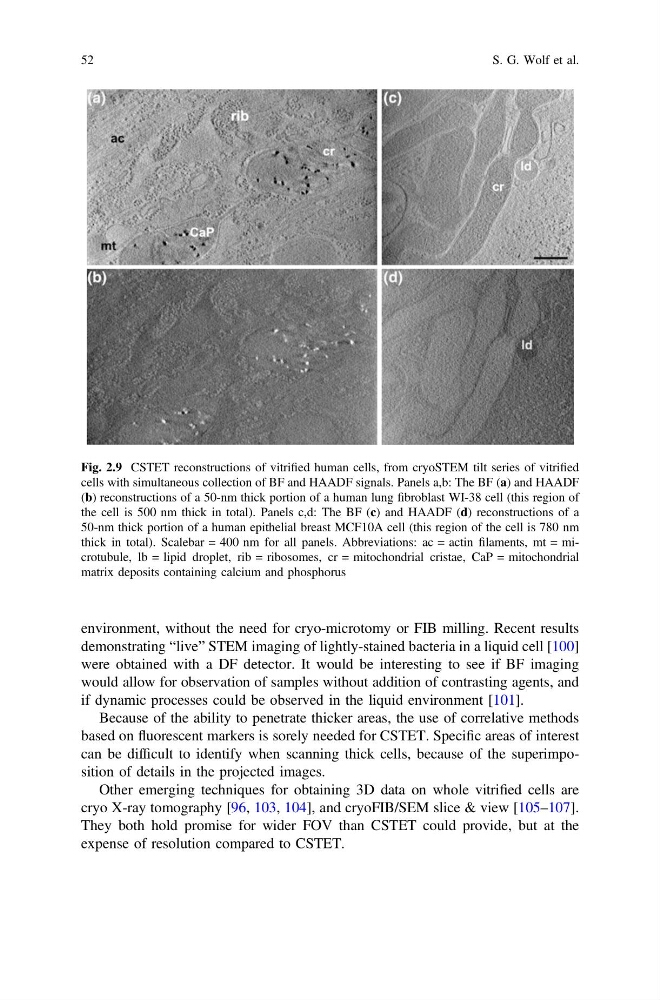
Fig. 2.9 CSTET reconstructions of vitrified human cells, from cryoSTEM tilt series of vitrified
cells with simultaneous collection of BF and HAADF signals. Panels a,b: The BF (a) and HAADF
(b) reconstructions of a 50-nm thick portion of a human lung fibroblast WI-38 cell (this region of
the cell is 500 nm thick in total). Panels c,d: The BF (c) and HAADF (d) reconstructions of a
50-nm thick portion of a human epithelial breast MCF10A cell (this region of the cell is 780 nm
thick in total). Scalebar = 400 nm for all panels. Abbreviations: ac = actin filaments, mt = microtubule, lb = lipid droplet, rib = ribosomes, cr = mitochondrial cristae, CaP = mitochondrial
matrix deposits containing calcium and phosphorus
52
S. G. Wolf et al.
demonstrating “live” STEM imaging of lightly-stained bacteria in a liquid cell [100]
were obtained with a DF detector. It would be interesting to see if BF imaging
would allow for observation of samples without addition of contrasting agents, and
if dynamic processes could be observed in the liquid environment [101].
Because of the ability to penetrate thicker areas, the use of correlative methods
based on fluorescent markers is sorely needed for CSTET. Specific areas of interest
can be difficult to identify when scanning thick cells, because of the superimposition of details in the projected images.
Other emerging techniques for obtaining 3D data on whole vitrified cells are
cryo X-ray tomography [96, 103, 104], and cryoFIB/SEM slice & view [105–107].
They both hold promise for wider FOV than CSTET could provide, but at the
expense of resolution compared to CSTET.
Fig. 2.9 CSTET reconstructions of vitrified human cells, from cryoSTEM tilt series of vitrified
cells with simultaneous collection of BF and HAADF signals. Panels a,b: The BF (a) and HAADF
(b) reconstructions of a 50-nm thick portion of a human lung fibroblast WI-38 cell (this region of
the cell is 500 nm thick in total). Panels c,d: The BF (c) and HAADF (d) reconstructions of a
50-nm thick portion of a human epithelial breast MCF10A cell (this region of the cell is 780 nm
thick in total). Scalebar = 400 nm for all panels. Abbreviations: ac = actin filaments, mt = microtubule, lb = lipid droplet, rib = ribosomes, cr = mitochondrial cristae, CaP = mitochondrial
matrix deposits containing calcium and phosphorus
52
S. G. Wolf et al.