

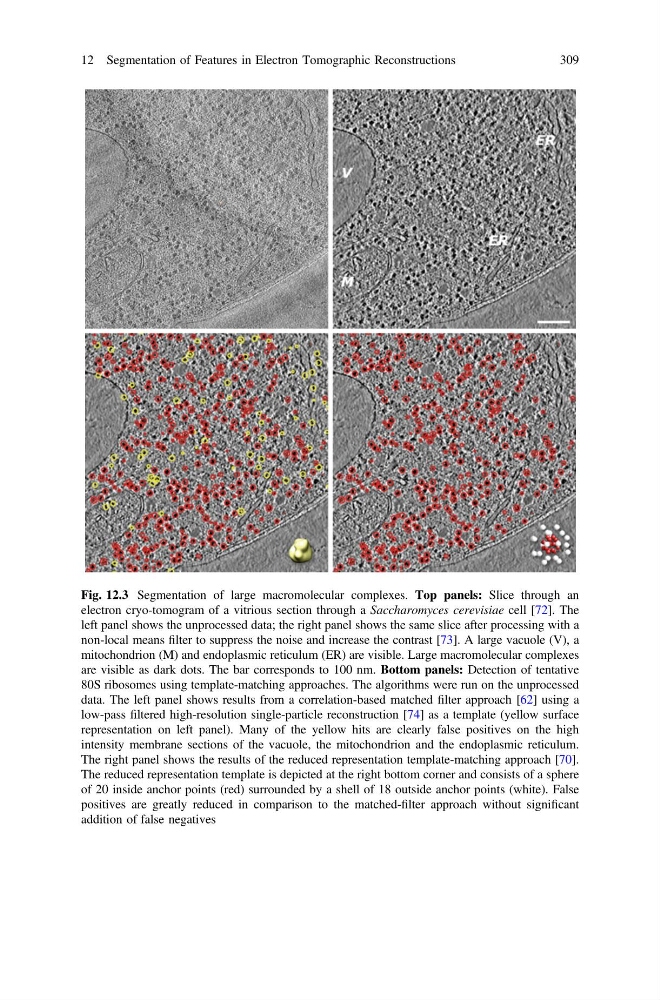
Fig. 12.3 Segmentation of large macromolecular complexes. Top panels: Slice through an
electron cryo-tomogram of a vitrious section through a Saccharomyces cerevisiae cell [72]. The
left panel shows the unprocessed data; the right panel shows the same slice after processing with a
non-local means filter to suppress the noise and increase the contrast [73]. A large vacuole (V), a
mitochondrion (M) and endoplasmic reticulum (ER) are visible. Large macromolecular complexes
are visible as dark dots. The bar corresponds to 100 nm. Bottom panels: Detection of tentative
80S ribosomes using template-matching approaches. The algorithms were run on the unprocessed
data. The left panel shows results from a correlation-based matched filter approach [62] using a
low-pass filtered high-resolution single-particle reconstruction [74] as a template (yellow surface
representation on left panel). Many of the yellow hits are clearly false positives on the high
intensity membrane sections of the vacuole, the mitochondrion and the endoplasmic reticulum.
The right panel shows the results of the reduced representation template-matching approach [70].
The reduced representation template is depicted at the right bottom corner and consists of a sphere
of 20 inside anchor points (red) surrounded by a shell of 18 outside anchor points (white). False
positives are greatly reduced in comparison to the matched-filter approach without significant
addition of false negatives
12 Segmentation of Features in Electron Tomographic Reconstructions
309
electron cryo-tomogram of a vitrious section through a Saccharomyces cerevisiae cell [72]. The
left panel shows the unprocessed data; the right panel shows the same slice after processing with a
non-local means filter to suppress the noise and increase the contrast [73]. A large vacuole (V), a
mitochondrion (M) and endoplasmic reticulum (ER) are visible. Large macromolecular complexes
are visible as dark dots. The bar corresponds to 100 nm. Bottom panels: Detection of tentative
80S ribosomes using template-matching approaches. The algorithms were run on the unprocessed
data. The left panel shows results from a correlation-based matched filter approach [62] using a
low-pass filtered high-resolution single-particle reconstruction [74] as a template (yellow surface
representation on left panel). Many of the yellow hits are clearly false positives on the high
intensity membrane sections of the vacuole, the mitochondrion and the endoplasmic reticulum.
The right panel shows the results of the reduced representation template-matching approach [70].
The reduced representation template is depicted at the right bottom corner and consists of a sphere
of 20 inside anchor points (red) surrounded by a shell of 18 outside anchor points (white). False
positives are greatly reduced in comparison to the matched-filter approach without significant
addition of false negatives
12 Segmentation of Features in Electron Tomographic Reconstructions
309