

automatically focus on the areas of major structural discrepancy between the references
[22]. While these multi-reference approaches are computationally less expensive and
can thus be applied to extended datasets of subtomograms, a high number of iterations
are necessary for convergence of class assignments, if the initial references do not
properly sample the structural and conformational landscape of the depicted macromolecular complexes.
9.5.3 Example Dataset
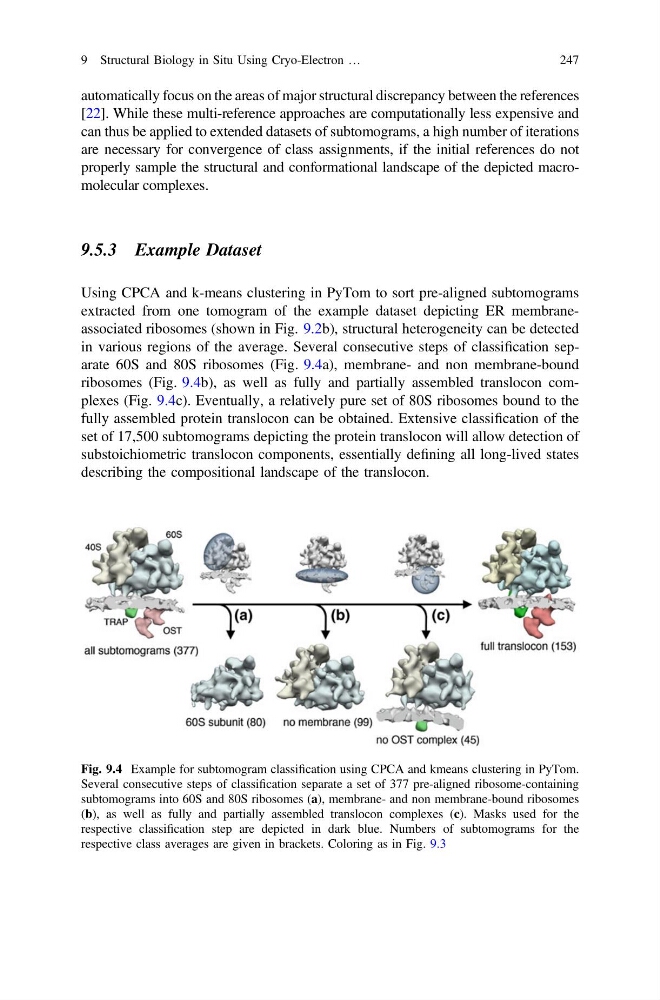
Using CPCA and k-means clustering in PyTom to sort pre-aligned subtomograms
extracted from one tomogram of the example dataset depicting ER membraneassociated ribosomes (shown in Fig. 9.2b), structural heterogeneity can be detected
in various regions of the average. Several consecutive steps of classification separate 60S and 80S ribosomes (Fig. 9.4a), membrane- and non membrane-bound
ribosomes (Fig. 9.4b), as well as fully and partially assembled translocon complexes (Fig. 9.4c). Eventually, a relatively pure set of 80S ribosomes bound to the
fully assembled protein translocon can be obtained. Extensive classification of the
set of 17,500 subtomograms depicting the protein translocon will allow detection of
substoichiometric translocon components, essentially defining all long-lived states
describing the compositional landscape of the translocon.
Fig. 9.4 Example for subtomogram classification using CPCA and kmeans clustering in PyTom.
Several consecutive steps of classification separate a set of 377 pre-aligned ribosome-containing
subtomograms into 60S and 80S ribosomes (a), membrane- and non membrane-bound ribosomes
(b), as well as fully and partially assembled translocon complexes (c). Masks used for the
respective classification step are depicted in dark blue. Numbers of subtomograms for the
respective class averages are given in brackets. Coloring as in Fig. 9.3
9 Structural Biology in Situ Using Cryo-Electron …
247
[22]. While these multi-reference approaches are computationally less expensive and
can thus be applied to extended datasets of subtomograms, a high number of iterations
are necessary for convergence of class assignments, if the initial references do not
properly sample the structural and conformational landscape of the depicted macromolecular complexes.
9.5.3 Example Dataset
Using CPCA and k-means clustering in PyTom to sort pre-aligned subtomograms
extracted from one tomogram of the example dataset depicting ER membraneassociated ribosomes (shown in Fig. 9.2b), structural heterogeneity can be detected
in various regions of the average. Several consecutive steps of classification separate 60S and 80S ribosomes (Fig. 9.4a), membrane- and non membrane-bound
ribosomes (Fig. 9.4b), as well as fully and partially assembled translocon complexes (Fig. 9.4c). Eventually, a relatively pure set of 80S ribosomes bound to the
fully assembled protein translocon can be obtained. Extensive classification of the
set of 17,500 subtomograms depicting the protein translocon will allow detection of
substoichiometric translocon components, essentially defining all long-lived states
describing the compositional landscape of the translocon.
Fig. 9.4 Example for subtomogram classification using CPCA and kmeans clustering in PyTom.
Several consecutive steps of classification separate a set of 377 pre-aligned ribosome-containing
subtomograms into 60S and 80S ribosomes (a), membrane- and non membrane-bound ribosomes
(b), as well as fully and partially assembled translocon complexes (c). Masks used for the
respective classification step are depicted in dark blue. Numbers of subtomograms for the
respective class averages are given in brackets. Coloring as in Fig. 9.3
9 Structural Biology in Situ Using Cryo-Electron …
247