

9.4 Subtomogram Alignment
By iterative alignment and averaging of subtomograms, all depicting the same
macromolecular complex, the SNR and resolution of structural information can be
increased [12]. This section introduces various concepts for subtomogram alignment, focusing on the different scoring and sampling strategies that are commonly
used.
9.4.1 Scoring Strategies
The problem in subtomogram averaging is that the orientations and precise positions of particles in the subtomograms are not known. In mathematical terms, the
orientations and positions are hidden variables. In subtomogram averaging one
needs to find the values of these hidden parameters and the corresponding subtomogram average that explains the observed data best. An elegant approach to solve
this problem is based on maximum likelihood (ML) principles [13, 14]. This
methodology assigns a probability density distribution to each hidden variable.
Importantly, this distribution function is continuous, i.e., a particle does not have a
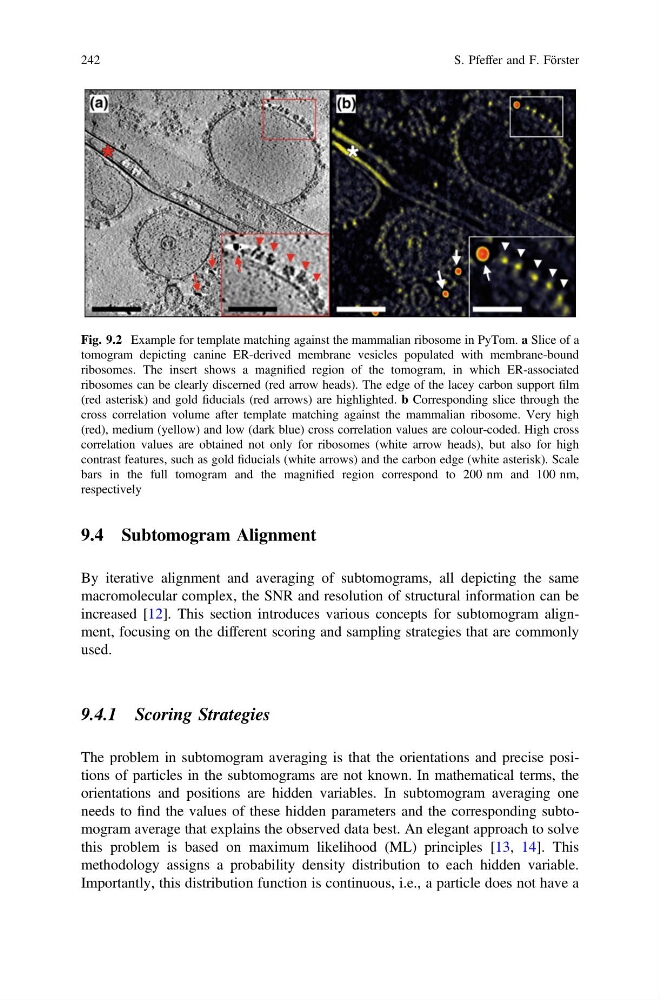
Fig. 9.2 Example for template matching against the mammalian ribosome in PyTom. a Slice of a
tomogram depicting canine ER-derived membrane vesicles populated with membrane-bound
ribosomes. The insert shows a magnified region of the tomogram, in which ER-associated
ribosomes can be clearly discerned (red arrow heads). The edge of the lacey carbon support film
(red asterisk) and gold fiducials (red arrows) are highlighted. b Corresponding slice through the
cross correlation volume after template matching against the mammalian ribosome. Very high
(red), medium (yellow) and low (dark blue) cross correlation values are colour-coded. High cross
correlation values are obtained not only for ribosomes (white arrow heads), but also for high
contrast features, such as gold fiducials (white arrows) and the carbon edge (white asterisk). Scale
bars in the full tomogram and the magnified region correspond to 200 nm and 100 nm,
respectively
242
S. Pfeffer and F. Förster
By iterative alignment and averaging of subtomograms, all depicting the same
macromolecular complex, the SNR and resolution of structural information can be
increased [12]. This section introduces various concepts for subtomogram alignment, focusing on the different scoring and sampling strategies that are commonly
used.
9.4.1 Scoring Strategies
The problem in subtomogram averaging is that the orientations and precise positions of particles in the subtomograms are not known. In mathematical terms, the
orientations and positions are hidden variables. In subtomogram averaging one
needs to find the values of these hidden parameters and the corresponding subtomogram average that explains the observed data best. An elegant approach to solve
this problem is based on maximum likelihood (ML) principles [13, 14]. This
methodology assigns a probability density distribution to each hidden variable.
Importantly, this distribution function is continuous, i.e., a particle does not have a
Fig. 9.2 Example for template matching against the mammalian ribosome in PyTom. a Slice of a
tomogram depicting canine ER-derived membrane vesicles populated with membrane-bound
ribosomes. The insert shows a magnified region of the tomogram, in which ER-associated
ribosomes can be clearly discerned (red arrow heads). The edge of the lacey carbon support film
(red asterisk) and gold fiducials (red arrows) are highlighted. b Corresponding slice through the
cross correlation volume after template matching against the mammalian ribosome. Very high
(red), medium (yellow) and low (dark blue) cross correlation values are colour-coded. High cross
correlation values are obtained not only for ribosomes (white arrow heads), but also for high
contrast features, such as gold fiducials (white arrows) and the carbon edge (white asterisk). Scale
bars in the full tomogram and the magnified region correspond to 200 nm and 100 nm,
respectively
242
S. Pfeffer and F. Förster