

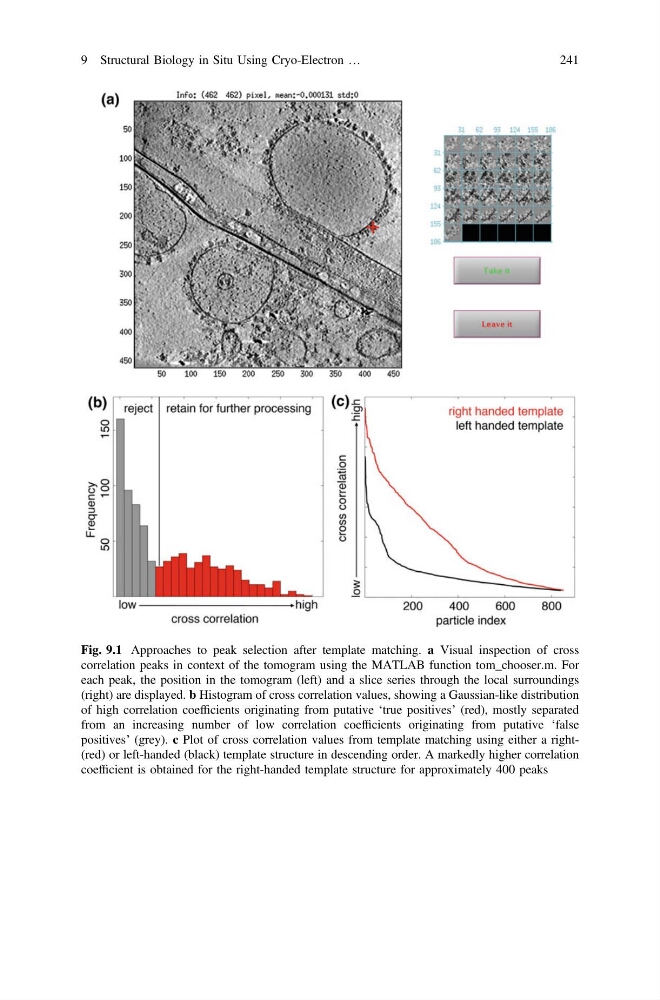
Fig. 9.1 Approaches to peak selection after template matching. a Visual inspection of cross
correlation peaks in context of the tomogram using the MATLAB function tom_chooser.m. For
each peak, the position in the tomogram (left) and a slice series through the local surroundings
(right) are displayed. b Histogram of cross correlation values, showing a Gaussian-like distribution
of high correlation coefficients originating from putative ‘true positives’ (red), mostly separated
from an increasing number of low correlation coefficients originating from putative ‘false
positives’ (grey). c Plot of cross correlation values from template matching using either a right(red) or left-handed (black) template structure in descending order. A markedly higher correlation
coefficient is obtained for the right-handed template structure for approximately 400 peaks
9 Structural Biology in Situ Using Cryo-Electron …
241
correlation peaks in context of the tomogram using the MATLAB function tom_chooser.m. For
each peak, the position in the tomogram (left) and a slice series through the local surroundings
(right) are displayed. b Histogram of cross correlation values, showing a Gaussian-like distribution
of high correlation coefficients originating from putative ‘true positives’ (red), mostly separated
from an increasing number of low correlation coefficients originating from putative ‘false
positives’ (grey). c Plot of cross correlation values from template matching using either a right(red) or left-handed (black) template structure in descending order. A markedly higher correlation
coefficient is obtained for the right-handed template structure for approximately 400 peaks
9 Structural Biology in Situ Using Cryo-Electron …
241