

with filamentous structures aligned with the axis [68]. Perpendicular to the tilt axis,
the resolution is limited to the overlap of neighboring central sections in frequency
space (see below). In the third direction, the limited tilt range results in a missing
wedge. The latter is characterized by the apparent elongation or smearing of
objections in the z direction (parallel to the electron beam). All of these factors
decrease the value of a single resolution estimate for a tomogram.
Crowther et al. [13] made the original attempt to give an estimate of the resolution for a limited number of images. Given a tilt series with a constant step
increment in the tilt angle, the number of images, m, required to achieve a desired
resolution, d, for a particle of size D, was derived as:
m % p
D
d
(this equation is also known as the Crowther criterion).
This equation can be derived in a different way that is more intuitive when
considering Fourier reconstruction. Placing two adjacent central sections from a tilt
series in frequency space is separated by the tilt step size, Δa, so that the central
sections overlap up to a point. At this point, k r , the planes are separated by one
voxel unit distance, so that:
Dak r ¼ 1
The resolution (inverse frequency) at this point is then:
d ¼
D
k r
¼ DDa
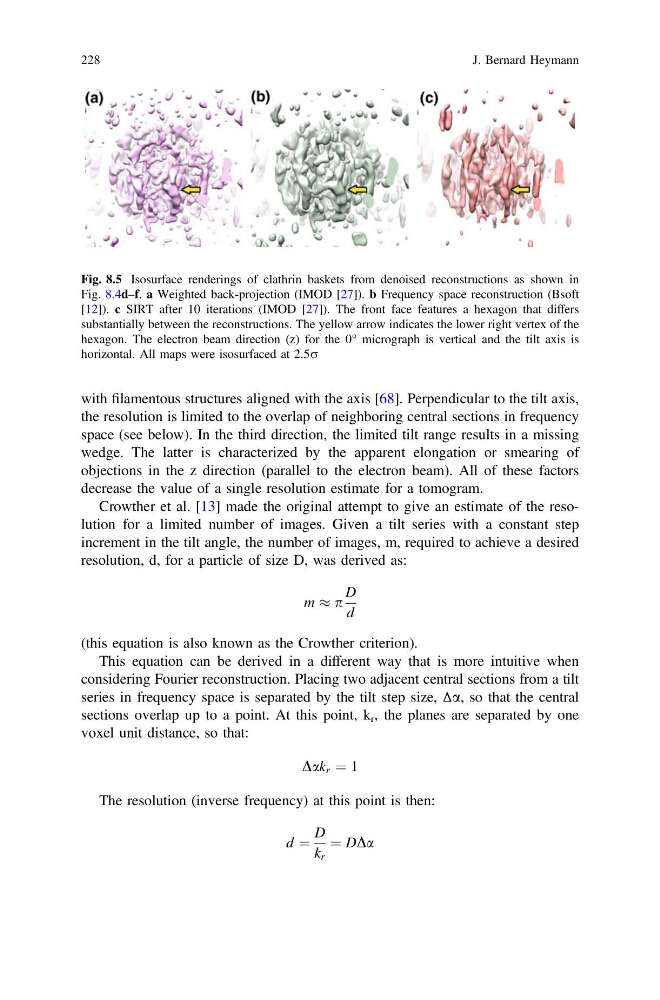
Fig. 8.5 Isosurface renderings of clathrin baskets from denoised reconstructions as shown in
Fig. 8.4d–f. a Weighted back-projection (IMOD [27]). b Frequency space reconstruction (Bsoft
[12]). c SIRT after 10 iterations (IMOD [27]). The front face features a hexagon that differs
substantially between the reconstructions. The yellow arrow indicates the lower right vertex of the
hexagon. The electron beam direction (z) for the 0° micrograph is vertical and the tilt axis is
horizontal. All maps were isosurfaced at 2.5r
228
J. Bernard Heymann
the resolution is limited to the overlap of neighboring central sections in frequency
space (see below). In the third direction, the limited tilt range results in a missing
wedge. The latter is characterized by the apparent elongation or smearing of
objections in the z direction (parallel to the electron beam). All of these factors
decrease the value of a single resolution estimate for a tomogram.
Crowther et al. [13] made the original attempt to give an estimate of the resolution for a limited number of images. Given a tilt series with a constant step
increment in the tilt angle, the number of images, m, required to achieve a desired
resolution, d, for a particle of size D, was derived as:
m % p
D
d
(this equation is also known as the Crowther criterion).
This equation can be derived in a different way that is more intuitive when
considering Fourier reconstruction. Placing two adjacent central sections from a tilt
series in frequency space is separated by the tilt step size, Δa, so that the central
sections overlap up to a point. At this point, k r , the planes are separated by one
voxel unit distance, so that:
Dak r ¼ 1
The resolution (inverse frequency) at this point is then:
d ¼
D
k r
¼ DDa
Fig. 8.5 Isosurface renderings of clathrin baskets from denoised reconstructions as shown in
Fig. 8.4d–f. a Weighted back-projection (IMOD [27]). b Frequency space reconstruction (Bsoft
[12]). c SIRT after 10 iterations (IMOD [27]). The front face features a hexagon that differs
substantially between the reconstructions. The yellow arrow indicates the lower right vertex of the
hexagon. The electron beam direction (z) for the 0° micrograph is vertical and the tilt axis is
horizontal. All maps were isosurfaced at 2.5r
228
J. Bernard Heymann