

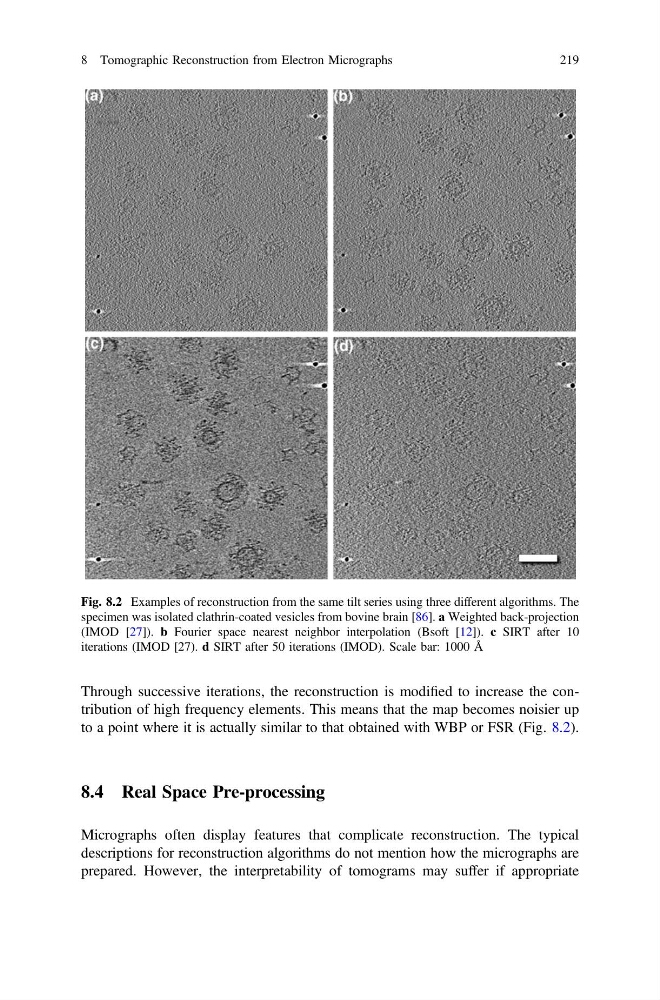
Through successive iterations, the reconstruction is modified to increase the contribution of high frequency elements. This means that the map becomes noisier up
to a point where it is actually similar to that obtained with WBP or FSR (Fig. 8.2).
8.4 Real Space Pre-processing
Micrographs often display features that complicate reconstruction. The typical
descriptions for reconstruction algorithms do not mention how the micrographs are
prepared. However, the interpretability of tomograms may suffer if appropriate
Fig. 8.2 Examples of reconstruction from the same tilt series using three different algorithms. The
specimen was isolated clathrin-coated vesicles from bovine brain [86]. a Weighted back-projection
(IMOD [27]). b Fourier space nearest neighbor interpolation (Bsoft [12]). c SIRT after 10
iterations (IMOD [27). d SIRT after 50 iterations (IMOD). Scale bar: 1000 Å
8 Tomographic Reconstruction from Electron Micrographs
219
to a point where it is actually similar to that obtained with WBP or FSR (Fig. 8.2).
8.4 Real Space Pre-processing
Micrographs often display features that complicate reconstruction. The typical
descriptions for reconstruction algorithms do not mention how the micrographs are
prepared. However, the interpretability of tomograms may suffer if appropriate
Fig. 8.2 Examples of reconstruction from the same tilt series using three different algorithms. The
specimen was isolated clathrin-coated vesicles from bovine brain [86]. a Weighted back-projection
(IMOD [27]). b Fourier space nearest neighbor interpolation (Bsoft [12]). c SIRT after 10
iterations (IMOD [27). d SIRT after 50 iterations (IMOD). Scale bar: 1000 Å
8 Tomographic Reconstruction from Electron Micrographs
219