

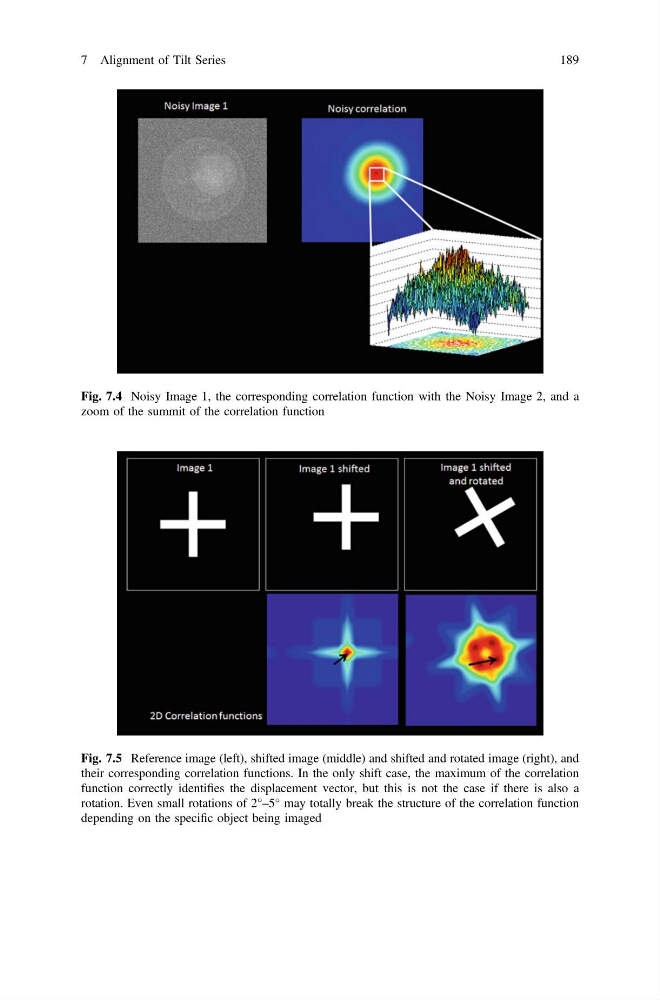
Fig. 7.4 Noisy Image 1, the corresponding correlation function with the Noisy Image 2, and a
zoom of the summit of the correlation function
Fig. 7.5 Reference image (left), shifted image (middle) and shifted and rotated image (right), and
their corresponding correlation functions. In the only shift case, the maximum of the correlation
function correctly identifies the displacement vector, but this is not the case if there is also a
rotation. Even small rotations of 2°–5° may totally break the structure of the correlation function
depending on the specific object being imaged
7 Alignment of Tilt Series
189
zoom of the summit of the correlation function
Fig. 7.5 Reference image (left), shifted image (middle) and shifted and rotated image (right), and
their corresponding correlation functions. In the only shift case, the maximum of the correlation
function correctly identifies the displacement vector, but this is not the case if there is also a
rotation. Even small rotations of 2°–5° may totally break the structure of the correlation function
depending on the specific object being imaged
7 Alignment of Tilt Series
189