

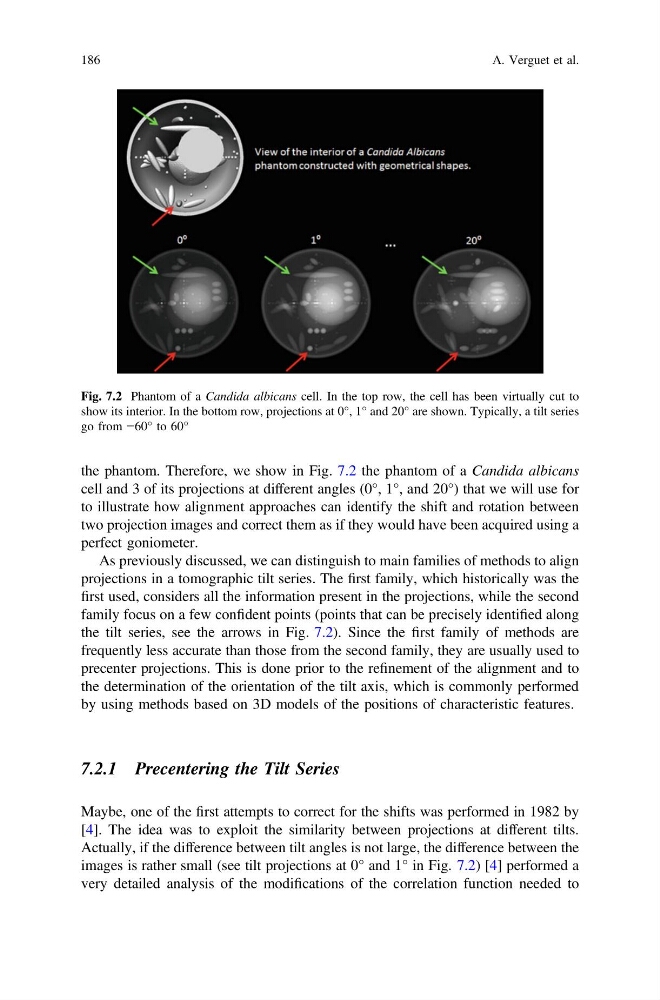
the phantom. Therefore, we show in Fig. 7.2 the phantom of a Candida albicans
cell and 3 of its projections at different angles (0°, 1°, and 20°) that we will use for
to illustrate how alignment approaches can identify the shift and rotation between
two projection images and correct them as if they would have been acquired using a
perfect goniometer.
As previously discussed, we can distinguish to main families of methods to align
projections in a tomographic tilt series. The first family, which historically was the
first used, considers all the information present in the projections, while the second
family focus on a few confident points (points that can be precisely identified along
the tilt series, see the arrows in Fig. 7.2). Since the first family of methods are
frequently less accurate than those from the second family, they are usually used to
precenter projections. This is done prior to the refinement of the alignment and to
the determination of the orientation of the tilt axis, which is commonly performed
by using methods based on 3D models of the positions of characteristic features.
7.2.1 Precentering the Tilt Series
Maybe, one of the first attempts to correct for the shifts was performed in 1982 by
[4]. The idea was to exploit the similarity between projections at different tilts.
Actually, if the difference between tilt angles is not large, the difference between the
images is rather small (see tilt projections at 0° and 1° in Fig. 7.2) [4] performed a
very detailed analysis of the modifications of the correlation function needed to
Fig. 7.2 Phantom of a Candida albicans cell. In the top row, the cell has been virtually cut to
show its interior. In the bottom row, projections at 0°, 1° and 20° are shown. Typically, a tilt series
go from −60° to 60°
186
A. Verguet et al.
cell and 3 of its projections at different angles (0°, 1°, and 20°) that we will use for
to illustrate how alignment approaches can identify the shift and rotation between
two projection images and correct them as if they would have been acquired using a
perfect goniometer.
As previously discussed, we can distinguish to main families of methods to align
projections in a tomographic tilt series. The first family, which historically was the
first used, considers all the information present in the projections, while the second
family focus on a few confident points (points that can be precisely identified along
the tilt series, see the arrows in Fig. 7.2). Since the first family of methods are
frequently less accurate than those from the second family, they are usually used to
precenter projections. This is done prior to the refinement of the alignment and to
the determination of the orientation of the tilt axis, which is commonly performed
by using methods based on 3D models of the positions of characteristic features.
7.2.1 Precentering the Tilt Series
Maybe, one of the first attempts to correct for the shifts was performed in 1982 by
[4]. The idea was to exploit the similarity between projections at different tilts.
Actually, if the difference between tilt angles is not large, the difference between the
images is rather small (see tilt projections at 0° and 1° in Fig. 7.2) [4] performed a
very detailed analysis of the modifications of the correlation function needed to
Fig. 7.2 Phantom of a Candida albicans cell. In the top row, the cell has been virtually cut to
show its interior. In the bottom row, projections at 0°, 1° and 20° are shown. Typically, a tilt series
go from −60° to 60°
186
A. Verguet et al.