

tiled image from the entire DAPI-stained ribbon is acquired. The DAPI labeled nuclei
are a convenient bright label that can be used to localize the region of interest to be
subsequently imaged at higher magnification. Other labels for low-magnification
mapping that can be used depending on the experimental need, are tubulin, GABA,
fluorescent proteins, or any other bright signal that labels larger structures (on the
order of several microns) which persists on multiple serial sections. The desired
region for imaging is chosen on a section from the low-magnification map, and
software tools are used to map the same region on each serial section. The generated
list of coordinates is used for automated imaging at high magnification (typically with
a 63 Â objective). After imaging, the antibodies are eluted from the sections using a
high pH solution, and a new combination of antibodies is applied and imaged. This
cycle can be repeated many times. The highest number of cycles achieved by us is 12;
the number of cycles is limited by the number of available relevant antibodies, and,
occasionally, by accidental damage to the coverslip. It should be noted that antibody
elution somewhat decreases the ultrastructural quality of the tissue for the subsequent
EM imaging [18]. This appears to be related to the high pH of the elution solution and
occurs upon the first application of the elution solution. Subsequent rounds of
staining and elution do not result in noticeable decrease of ultrastructure.
After completion of the immunofluorescent imaging, the antibodies are eluted
again, the ribbon is washed well and poststained with heavy metals for electron
microscopic imaging. The Lowicryl sections, and even more so the eluted Lowicryl
sections, have much lower contrast compared to conventional Epon sections, which
can be a problem for SEM imaging. Contrast can be improved by a pretreatment
with 0.1% KMnO 4 dissolved in 0.1 N H 2 SO [49], followed by a longer application
of uranyl acetate (30 min) and, finally, lead citrate. Ribbons are imaged in an
FESEM microscope using the backscatter detector.
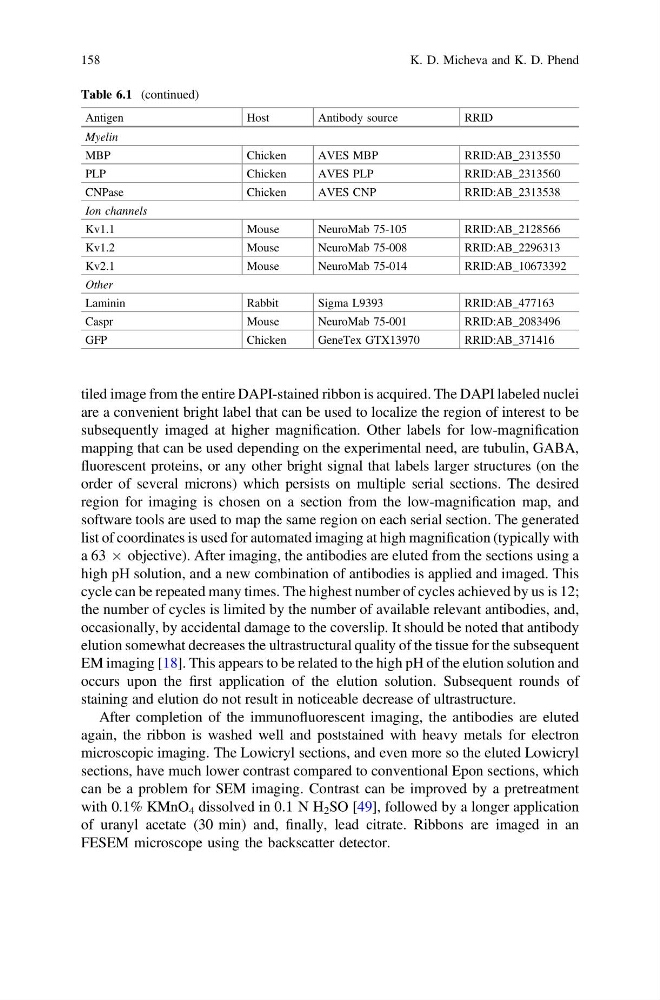
Table 6.1 (continued)
Antigen
Host
Antibody source
RRID
Myelin
MBP
Chicken
AVES MBP
RRID:AB_2313550
PLP
Chicken
AVES PLP
RRID:AB_2313560
CNPase
Chicken
AVES CNP
RRID:AB_2313538
Ion channels
Kv1.1
Mouse
NeuroMab 75-105
RRID:AB_2128566
Kv1.2
Mouse
NeuroMab 75-008
RRID:AB_2296313
Kv2.1
Mouse
NeuroMab 75-014
RRID:AB_10673392
Other
Laminin
Rabbit
Sigma L9393
RRID:AB_477163
Caspr
Mouse
NeuroMab 75-001
RRID:AB_2083496
GFP
Chicken
GeneTex GTX13970
RRID:AB_371416
158
K. D. Micheva and K. D. Phend
are a convenient bright label that can be used to localize the region of interest to be
subsequently imaged at higher magnification. Other labels for low-magnification
mapping that can be used depending on the experimental need, are tubulin, GABA,
fluorescent proteins, or any other bright signal that labels larger structures (on the
order of several microns) which persists on multiple serial sections. The desired
region for imaging is chosen on a section from the low-magnification map, and
software tools are used to map the same region on each serial section. The generated
list of coordinates is used for automated imaging at high magnification (typically with
a 63 Â objective). After imaging, the antibodies are eluted from the sections using a
high pH solution, and a new combination of antibodies is applied and imaged. This
cycle can be repeated many times. The highest number of cycles achieved by us is 12;
the number of cycles is limited by the number of available relevant antibodies, and,
occasionally, by accidental damage to the coverslip. It should be noted that antibody
elution somewhat decreases the ultrastructural quality of the tissue for the subsequent
EM imaging [18]. This appears to be related to the high pH of the elution solution and
occurs upon the first application of the elution solution. Subsequent rounds of
staining and elution do not result in noticeable decrease of ultrastructure.
After completion of the immunofluorescent imaging, the antibodies are eluted
again, the ribbon is washed well and poststained with heavy metals for electron
microscopic imaging. The Lowicryl sections, and even more so the eluted Lowicryl
sections, have much lower contrast compared to conventional Epon sections, which
can be a problem for SEM imaging. Contrast can be improved by a pretreatment
with 0.1% KMnO 4 dissolved in 0.1 N H 2 SO [49], followed by a longer application
of uranyl acetate (30 min) and, finally, lead citrate. Ribbons are imaged in an
FESEM microscope using the backscatter detector.
Table 6.1 (continued)
Antigen
Host
Antibody source
RRID
Myelin
MBP
Chicken
AVES MBP
RRID:AB_2313550
PLP
Chicken
AVES PLP
RRID:AB_2313560
CNPase
Chicken
AVES CNP
RRID:AB_2313538
Ion channels
Kv1.1
Mouse
NeuroMab 75-105
RRID:AB_2128566
Kv1.2
Mouse
NeuroMab 75-008
RRID:AB_2296313
Kv2.1
Mouse
NeuroMab 75-014
RRID:AB_10673392
Other
Laminin
Rabbit
Sigma L9393
RRID:AB_477163
Caspr
Mouse
NeuroMab 75-001
RRID:AB_2083496
GFP
Chicken
GeneTex GTX13970
RRID:AB_371416
158
K. D. Micheva and K. D. Phend