

microscope (FESEM). Furthermore, several commercial solutions to automate
correlated light and SEM imaging now exist [40, 41].
The imaging of the same serial sections mounted on coverslips with both
immunofluorescence and in the scanning electron microscope, is termed conjugate
IF-SEM array tomography. This is a special case of correlative microscopy where
exactly the same physical sample (array of serial ultrathin sections) is imaged in two
different modalities, light and electron microscopy, and the resulting images are
registered with voxel-to-voxel accuracy.
6.4 Array Tomography Sample Preparation: Workflow
and General Considerations
Sample preparation for conjugate array tomography begins with chemical fixation
that for many samples is best achieved through transcardial perfusion. When this is
not possible, for example, for human surgical tissue or brain slices from electrophysiological experiments, immersion fixation is used. Good ultrastructural
preservation is achieved using a combination of formaldehyde and glutaraldehyde.
The use of glutaraldehyde offers the additional advantage of increasing the retention
of small molecules, such as GABA and glutamate [42, 43]. And while glutaraldehyde significantly increases tissue autofluorescence and nonspecific antibody
binding, this effect is much less pronounced in the case of the ultrathin sections
used for AT, and can be further alleviated by preincubations with sodium
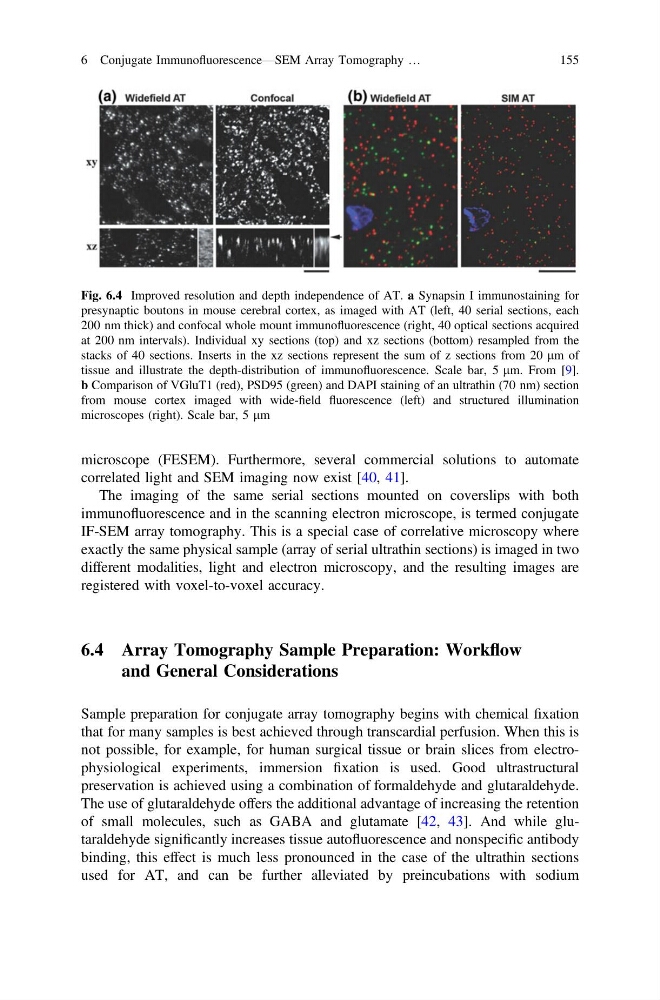
Fig. 6.4 Improved resolution and depth independence of AT. a Synapsin I immunostaining for
presynaptic boutons in mouse cerebral cortex, as imaged with AT (left, 40 serial sections, each
200 nm thick) and confocal whole mount immunofluorescence (right, 40 optical sections acquired
at 200 nm intervals). Individual xy sections (top) and xz sections (bottom) resampled from the
stacks of 40 sections. Inserts in the xz sections represent the sum of z sections from 20 lm of
tissue and illustrate the depth-distribution of immunofluorescence. Scale bar, 5 lm. From [9].
b Comparison of VGluT1 (red), PSD95 (green) and DAPI staining of an ultrathin (70 nm) section
from mouse cortex imaged with wide-field fluorescence (left) and structured illumination
microscopes (right). Scale bar, 5 lm
6 Conjugate Immunofluorescence—SEM Array Tomography …
155
correlated light and SEM imaging now exist [40, 41].
The imaging of the same serial sections mounted on coverslips with both
immunofluorescence and in the scanning electron microscope, is termed conjugate
IF-SEM array tomography. This is a special case of correlative microscopy where
exactly the same physical sample (array of serial ultrathin sections) is imaged in two
different modalities, light and electron microscopy, and the resulting images are
registered with voxel-to-voxel accuracy.
6.4 Array Tomography Sample Preparation: Workflow
and General Considerations
Sample preparation for conjugate array tomography begins with chemical fixation
that for many samples is best achieved through transcardial perfusion. When this is
not possible, for example, for human surgical tissue or brain slices from electrophysiological experiments, immersion fixation is used. Good ultrastructural
preservation is achieved using a combination of formaldehyde and glutaraldehyde.
The use of glutaraldehyde offers the additional advantage of increasing the retention
of small molecules, such as GABA and glutamate [42, 43]. And while glutaraldehyde significantly increases tissue autofluorescence and nonspecific antibody
binding, this effect is much less pronounced in the case of the ultrathin sections
used for AT, and can be further alleviated by preincubations with sodium
Fig. 6.4 Improved resolution and depth independence of AT. a Synapsin I immunostaining for
presynaptic boutons in mouse cerebral cortex, as imaged with AT (left, 40 serial sections, each
200 nm thick) and confocal whole mount immunofluorescence (right, 40 optical sections acquired
at 200 nm intervals). Individual xy sections (top) and xz sections (bottom) resampled from the
stacks of 40 sections. Inserts in the xz sections represent the sum of z sections from 20 lm of
tissue and illustrate the depth-distribution of immunofluorescence. Scale bar, 5 lm. From [9].
b Comparison of VGluT1 (red), PSD95 (green) and DAPI staining of an ultrathin (70 nm) section
from mouse cortex imaged with wide-field fluorescence (left) and structured illumination
microscopes (right). Scale bar, 5 lm
6 Conjugate Immunofluorescence—SEM Array Tomography …
155