

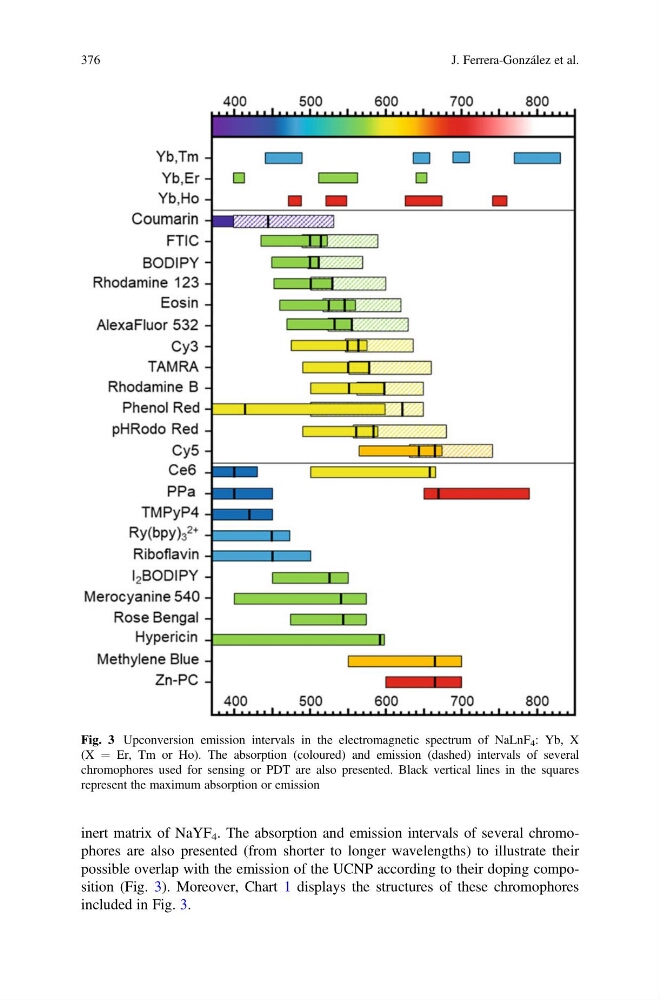
inert matrix of NaYF 4 . The absorption and emission intervals of several chromophores are also presented (from shorter to longer wavelengths) to illustrate their
possible overlap with the emission of the UCNP according to their doping composition (Fig. 3). Moreover, Chart 1 displays the structures of these chromophores
included in Fig. 3.
Fig. 3 Upconversion emission intervals in the electromagnetic spectrum of NaLnF 4 : Yb, X
(X ¼ Er, Tm or Ho). The absorption (coloured) and emission (dashed) intervals of several
chromophores used for sensing or PDT are also presented. Black vertical lines in the squares
represent the maximum absorption or emission
376
J. Ferrera-González et al.
possible overlap with the emission of the UCNP according to their doping composition (Fig. 3). Moreover, Chart 1 displays the structures of these chromophores
included in Fig. 3.
Fig. 3 Upconversion emission intervals in the electromagnetic spectrum of NaLnF 4 : Yb, X
(X ¼ Er, Tm or Ho). The absorption (coloured) and emission (dashed) intervals of several
chromophores used for sensing or PDT are also presented. Black vertical lines in the squares
represent the maximum absorption or emission
376
J. Ferrera-González et al.