

montmorillonite obtained from Mikawa, Japan (503 nm), and Bengel A obtained
from China (Hojun Ind. Co., Japan) (532 nm) [151]. This is a rare example for the
retinal Schiff base to show the color variation after the isolation from the protein.
4.1.2 Effect of the Dye Aggregation
Aggregation of such dyes [152–156] as acridine orange [157–159], methylene blue
[23, 40, 160], azobenzenes [62, 161–169], merocyanines [170, 171], rhodamines
[172–178], nile blue A [179], and porphyrins [180–182] has been reported to be
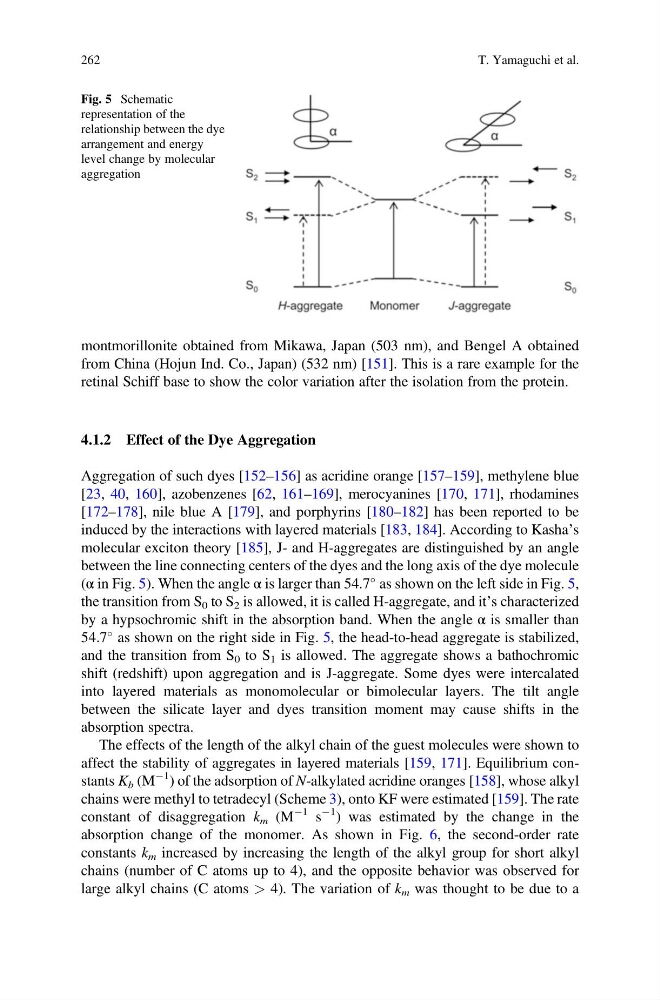
induced by the interactions with layered materials [183, 184]. According to Kasha’s
molecular exciton theory [185], J- and H-aggregates are distinguished by an angle
between the line connecting centers of the dyes and the long axis of the dye molecule
(α in Fig. 5). When the angle α is larger than 54.7
as shown on the left side in Fig. 5,
the transition from S 0 to S 2 is allowed, it is called H-aggregate, and it’s characterized
by a hypsochromic shift in the absorption band. When the angle α is smaller than
54.7
as shown on the right side in Fig. 5, the head-to-head aggregate is stabilized,
and the transition from S 0 to S 1 is allowed. The aggregate shows a bathochromic
shift (redshift) upon aggregation and is J-aggregate. Some dyes were intercalated
into layered materials as monomolecular or bimolecular layers. The tilt angle
between the silicate layer and dyes transition moment may cause shifts in the
absorption spectra.
The effects of the length of the alkyl chain of the guest molecules were shown to
affect the stability of aggregates in layered materials [159, 171]. Equilibrium constants K b (M
À1 ) of the adsorption of N-alkylated acridine oranges [158], whose alkyl
chains were methyl to tetradecyl (Scheme 3), onto KF were estimated [159]. The rate
constant of disaggregation k m (M
À1 s
À1 ) was estimated by the change in the
absorption change of the monomer. As shown in Fig. 6, the second-order rate
constants k m increased by increasing the length of the alkyl group for short alkyl
chains (number of C atoms up to 4), and the opposite behavior was observed for
large alkyl chains (C atoms > 4). The variation of k m was thought to be due to a
Fig. 5 Schematic
representation of the
relationship between the dye
arrangement and energy
level change by molecular
aggregation
262
T. Yamaguchi et al.
from China (Hojun Ind. Co., Japan) (532 nm) [151]. This is a rare example for the
retinal Schiff base to show the color variation after the isolation from the protein.
4.1.2 Effect of the Dye Aggregation
Aggregation of such dyes [152–156] as acridine orange [157–159], methylene blue
[23, 40, 160], azobenzenes [62, 161–169], merocyanines [170, 171], rhodamines
[172–178], nile blue A [179], and porphyrins [180–182] has been reported to be
induced by the interactions with layered materials [183, 184]. According to Kasha’s
molecular exciton theory [185], J- and H-aggregates are distinguished by an angle
between the line connecting centers of the dyes and the long axis of the dye molecule
(α in Fig. 5). When the angle α is larger than 54.7
as shown on the left side in Fig. 5,
the transition from S 0 to S 2 is allowed, it is called H-aggregate, and it’s characterized
by a hypsochromic shift in the absorption band. When the angle α is smaller than
54.7
as shown on the right side in Fig. 5, the head-to-head aggregate is stabilized,
and the transition from S 0 to S 1 is allowed. The aggregate shows a bathochromic
shift (redshift) upon aggregation and is J-aggregate. Some dyes were intercalated
into layered materials as monomolecular or bimolecular layers. The tilt angle
between the silicate layer and dyes transition moment may cause shifts in the
absorption spectra.
The effects of the length of the alkyl chain of the guest molecules were shown to
affect the stability of aggregates in layered materials [159, 171]. Equilibrium constants K b (M
À1 ) of the adsorption of N-alkylated acridine oranges [158], whose alkyl
chains were methyl to tetradecyl (Scheme 3), onto KF were estimated [159]. The rate
constant of disaggregation k m (M
À1 s
À1 ) was estimated by the change in the
absorption change of the monomer. As shown in Fig. 6, the second-order rate
constants k m increased by increasing the length of the alkyl group for short alkyl
chains (number of C atoms up to 4), and the opposite behavior was observed for
large alkyl chains (C atoms > 4). The variation of k m was thought to be due to a
Fig. 5 Schematic
representation of the
relationship between the dye
arrangement and energy
level change by molecular
aggregation
262
T. Yamaguchi et al.