

suppressed by a suitable setup of the measurement and using solutions with absorbance <0.1. For a better understanding of the effect of intermolecular distances on
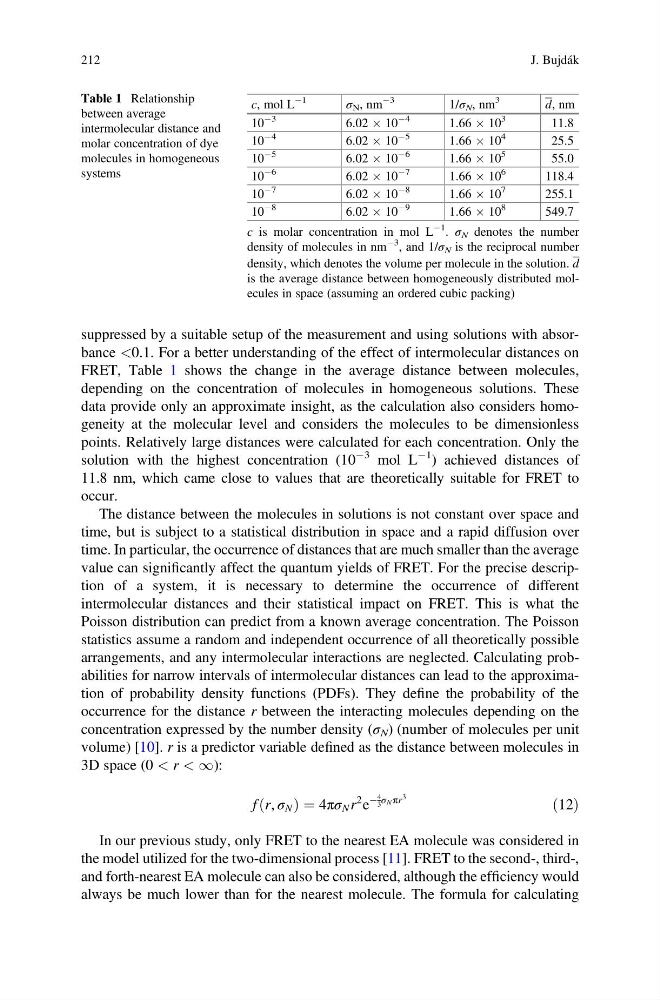
FRET, Table 1 shows the change in the average distance between molecules,
depending on the concentration of molecules in homogeneous solutions. These
data provide only an approximate insight, as the calculation also considers homogeneity at the molecular level and considers the molecules to be dimensionless
points. Relatively large distances were calculated for each concentration. Only the
solution with the highest concentration (10
À3 mol L
À1 ) achieved distances of
11.8 nm, which came close to values that are theoretically suitable for FRET to
occur.
The distance between the molecules in solutions is not constant over space and
time, but is subject to a statistical distribution in space and a rapid diffusion over
time. In particular, the occurrence of distances that are much smaller than the average
value can significantly affect the quantum yields of FRET. For the precise description of a system, it is necessary to determine the occurrence of different
intermolecular distances and their statistical impact on FRET. This is what the
Poisson distribution can predict from a known average concentration. The Poisson
statistics assume a random and independent occurrence of all theoretically possible
arrangements, and any intermolecular interactions are neglected. Calculating probabilities for narrow intervals of intermolecular distances can lead to the approximation of probability density functions (PDFs). They define the probability of the
occurrence for the distance r between the interacting molecules depending on the
concentration expressed by the number density (σ N ) (number of molecules per unit
volume) [10]. r is a predictor variable defined as the distance between molecules in
3D space (0 < r < 1):
f r, σ N
ð
Þ¼4πσ N r
2 e
À
4
3 σ N πr
3
ð12Þ
In our previous study, only FRET to the nearest EA molecule was considered in
the model utilized for the two-dimensional process [11]. FRET to the second-, third-,
and forth-nearest EA molecule can also be considered, although the efficiency would
always be much lower than for the nearest molecule. The formula for calculating
Table 1 Relationship
between average
intermolecular distance and
molar concentration of dye
molecules in homogeneous
systems
c, mol L
À1
σ N , nm
À3
1/σ N , nm
3
d, nm
10
À3
6.02 Â 10
À4
1.66 Â 10
3
11.8
10
À4
6.02 Â 10
À5
1.66 Â 10
4
25.5
10
À5
6.02 Â 10
À6
1.66 Â 10
5
55.0
10
À6
6.02 Â 10
À7
1.66 Â 10
6
118.4
10
À7
6.02 Â 10
À8
1.66 Â 10
7
255.1
10
À8
6.02 Â 10
À9
1.66 Â 10
8
549.7
c is molar concentration in mol L
À1
. σ N denotes the number
density of molecules in nm
À3
, and 1/σ N is the reciprocal number
density, which denotes the volume per molecule in the solution. d
is the average distance between homogeneously distributed molecules in space (assuming an ordered cubic packing)
212
J. Bujdák
FRET, Table 1 shows the change in the average distance between molecules,
depending on the concentration of molecules in homogeneous solutions. These
data provide only an approximate insight, as the calculation also considers homogeneity at the molecular level and considers the molecules to be dimensionless
points. Relatively large distances were calculated for each concentration. Only the
solution with the highest concentration (10
À3 mol L
À1 ) achieved distances of
11.8 nm, which came close to values that are theoretically suitable for FRET to
occur.
The distance between the molecules in solutions is not constant over space and
time, but is subject to a statistical distribution in space and a rapid diffusion over
time. In particular, the occurrence of distances that are much smaller than the average
value can significantly affect the quantum yields of FRET. For the precise description of a system, it is necessary to determine the occurrence of different
intermolecular distances and their statistical impact on FRET. This is what the
Poisson distribution can predict from a known average concentration. The Poisson
statistics assume a random and independent occurrence of all theoretically possible
arrangements, and any intermolecular interactions are neglected. Calculating probabilities for narrow intervals of intermolecular distances can lead to the approximation of probability density functions (PDFs). They define the probability of the
occurrence for the distance r between the interacting molecules depending on the
concentration expressed by the number density (σ N ) (number of molecules per unit
volume) [10]. r is a predictor variable defined as the distance between molecules in
3D space (0 < r < 1):
f r, σ N
ð
Þ¼4πσ N r
2 e
À
4
3 σ N πr
3
ð12Þ
In our previous study, only FRET to the nearest EA molecule was considered in
the model utilized for the two-dimensional process [11]. FRET to the second-, third-,
and forth-nearest EA molecule can also be considered, although the efficiency would
always be much lower than for the nearest molecule. The formula for calculating
Table 1 Relationship
between average
intermolecular distance and
molar concentration of dye
molecules in homogeneous
systems
c, mol L
À1
σ N , nm
À3
1/σ N , nm
3
d, nm
10
À3
6.02 Â 10
À4
1.66 Â 10
3
11.8
10
À4
6.02 Â 10
À5
1.66 Â 10
4
25.5
10
À5
6.02 Â 10
À6
1.66 Â 10
5
55.0
10
À6
6.02 Â 10
À7
1.66 Â 10
6
118.4
10
À7
6.02 Â 10
À8
1.66 Â 10
7
255.1
10
À8
6.02 Â 10
À9
1.66 Â 10
8
549.7
c is molar concentration in mol L
À1
. σ N denotes the number
density of molecules in nm
À3
, and 1/σ N is the reciprocal number
density, which denotes the volume per molecule in the solution. d
is the average distance between homogeneously distributed molecules in space (assuming an ordered cubic packing)
212
J. Bujdák