

3 Photochemical Property and Layered Materials
The properties of a molecule are affected by its surrounding field. Especially in the
case of photochemical properties, the effect of the surrounding field is large. Effects
on (1) molecular structure, (2) solvation, (3) intermolecular interactions, and so on
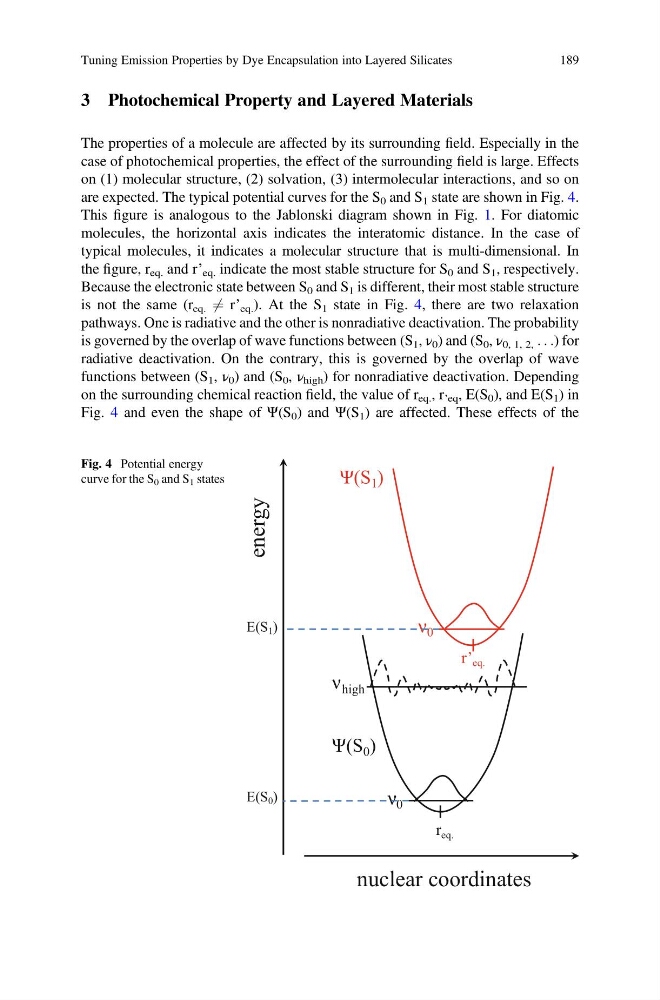
are expected. The typical potential curves for the S 0 and S 1 state are shown in Fig. 4.
This figure is analogous to the Jablonski diagram shown in Fig. 1. For diatomic
molecules, the horizontal axis indicates the interatomic distance. In the case of
typical molecules, it indicates a molecular structure that is multi-dimensional. In
the figure, r eq. and r’ eq. indicate the most stable structure for S 0 and S 1 , respectively.
Because the electronic state between S 0 and S 1 is different, their most stable structure
is not the same (r eq. 6 ¼ r’ eq. ). At the S 1 state in Fig. 4, there are two relaxation
pathways. One is radiative and the other is nonradiative deactivation. The probability
is governed by the overlap of wave functions between (S 1 , ν 0 ) and (S 0 , ν 0, 1, 2, . . .) for
radiative deactivation. On the contrary, this is governed by the overlap of wave
functions between (S 1 , ν 0 ) and (S 0 , ν high ) for nonradiative deactivation. Depending
on the surrounding chemical reaction field, the value of r eq. , r ’eq , E(S 0 ), and E(S 1 ) in
Fig. 4 and even the shape of Ψ(S 0 ) and Ψ(S 1 ) are affected. These effects of the
ν
ν
ν high
Ψ(S 1 )
Ψ(S 0 )
0
r eq.
r’ eq.
0
energy
nuclear coordinates
E(S 1 )
E(S 0 )
Fig. 4 Potential energy
curve for the S 0 and S 1 states
Tuning Emission Properties by Dye Encapsulation into Layered Silicates
189
The properties of a molecule are affected by its surrounding field. Especially in the
case of photochemical properties, the effect of the surrounding field is large. Effects
on (1) molecular structure, (2) solvation, (3) intermolecular interactions, and so on
are expected. The typical potential curves for the S 0 and S 1 state are shown in Fig. 4.
This figure is analogous to the Jablonski diagram shown in Fig. 1. For diatomic
molecules, the horizontal axis indicates the interatomic distance. In the case of
typical molecules, it indicates a molecular structure that is multi-dimensional. In
the figure, r eq. and r’ eq. indicate the most stable structure for S 0 and S 1 , respectively.
Because the electronic state between S 0 and S 1 is different, their most stable structure
is not the same (r eq. 6 ¼ r’ eq. ). At the S 1 state in Fig. 4, there are two relaxation
pathways. One is radiative and the other is nonradiative deactivation. The probability
is governed by the overlap of wave functions between (S 1 , ν 0 ) and (S 0 , ν 0, 1, 2, . . .) for
radiative deactivation. On the contrary, this is governed by the overlap of wave
functions between (S 1 , ν 0 ) and (S 0 , ν high ) for nonradiative deactivation. Depending
on the surrounding chemical reaction field, the value of r eq. , r ’eq , E(S 0 ), and E(S 1 ) in
Fig. 4 and even the shape of Ψ(S 0 ) and Ψ(S 1 ) are affected. These effects of the
ν
ν
ν high
Ψ(S 1 )
Ψ(S 0 )
0
r eq.
r’ eq.
0
energy
nuclear coordinates
E(S 1 )
E(S 0 )
Fig. 4 Potential energy
curve for the S 0 and S 1 states
Tuning Emission Properties by Dye Encapsulation into Layered Silicates
189