

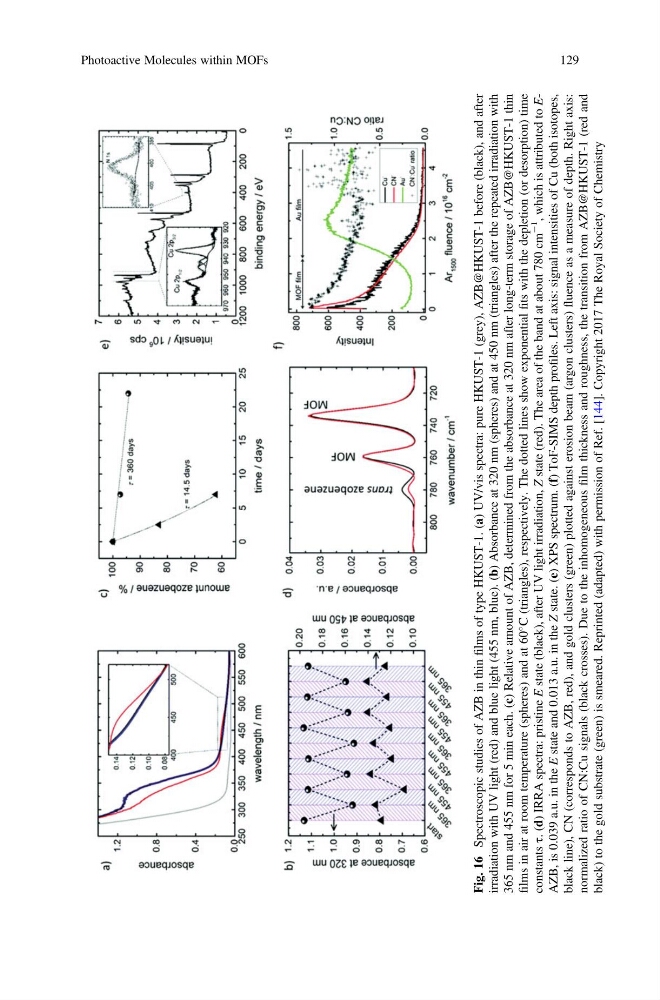
Fig. 16
Spectroscopic studies of AZB in thin
films of type HKUST-1. (a) UV/vis spectra: pure HKUST-1 (grey), AZB@HKUST-1 before (black), and after
irradiation with UV light (red) and blue light (455 nm, blue). (b) Absorbance at 320 nm (spheres) and at 450 nm (triangles) after the repeated irradiation with
365 nm and 455 nm for 5 min each. (c) Relative amount of AZB, determined from the absorbance at 320 nm after long-term storage of AZB@HKUST-1 thin
films in air at room temperature (spheres) and at 60
C (triangles), respectively. The dotted lines show exponential
fits with the depletion (or desorption) time
constants
τ. (d) IRRA spectra: pristine
E state (black), after UV light irradiation,
Z state (red). The area of the band at about 780 cm
À1
, which is attributed to
EAZB, is 0.039 a.u. in the
E state and 0.013 a.u. in the
Z state. (e) XPS spectrum. (f) ToF-SIMS depth profiles. Left axis: signal intensities of Cu (both isotopes,
black line), CN (corresponds to AZB, red), and gold clusters (green) plotted against erosion beam (argon clusters)
fluence as a measure of depth. Right axis:
normalized ratio of CN:Cu signals (black crosses). Due to the inhomogeneous
film thickness and roughness, the transition from AZB@HKUST-1 (red and
black) to the gold substrate (green) is smeared. Reprinted (adapted) with permission of Ref. [144]. Copyright 2017 The Royal Society of Chemistry
Photoactive Molecules within MOFs
129
Spectroscopic studies of AZB in thin
films of type HKUST-1. (a) UV/vis spectra: pure HKUST-1 (grey), AZB@HKUST-1 before (black), and after
irradiation with UV light (red) and blue light (455 nm, blue). (b) Absorbance at 320 nm (spheres) and at 450 nm (triangles) after the repeated irradiation with
365 nm and 455 nm for 5 min each. (c) Relative amount of AZB, determined from the absorbance at 320 nm after long-term storage of AZB@HKUST-1 thin
films in air at room temperature (spheres) and at 60
C (triangles), respectively. The dotted lines show exponential
fits with the depletion (or desorption) time
constants
τ. (d) IRRA spectra: pristine
E state (black), after UV light irradiation,
Z state (red). The area of the band at about 780 cm
À1
, which is attributed to
EAZB, is 0.039 a.u. in the
E state and 0.013 a.u. in the
Z state. (e) XPS spectrum. (f) ToF-SIMS depth profiles. Left axis: signal intensities of Cu (both isotopes,
black line), CN (corresponds to AZB, red), and gold clusters (green) plotted against erosion beam (argon clusters)
fluence as a measure of depth. Right axis:
normalized ratio of CN:Cu signals (black crosses). Due to the inhomogeneous
film thickness and roughness, the transition from AZB@HKUST-1 (red and
black) to the gold substrate (green) is smeared. Reprinted (adapted) with permission of Ref. [144]. Copyright 2017 The Royal Society of Chemistry
Photoactive Molecules within MOFs
129