

20
J. Wakeley
The numerator of Tajima’s D compares two unbiased estimates of θ , one from
pairwise differences and one from segregating sites. Tajima’s D thus has an expected
value very nearly equal to zero (it is not exactly equal to zero because of the
denominator), and significant deviations either in the positive or the negative
direction warrant rejection of the standard neutral coalescent. The denominator is a
normalization factor which decreases the sensitivity of the sample size and requires
an estimate of the variance of the numerator, typically made from the same data.
Because S and π are linear functions of the site frequencies (Tajima 1997),
Tajima’s D may be viewed as a measure of goodness-of-fit of the prediction
displayed in Fig. 1.4a (for n = 20). Actually, Tajima’s D depends only on the
folded site-frequency spectrum because sites that contribute to ξ i and ξ n − i are
weighted equally, proportional to i(n − i), in the calculation of π, and all sites are
weighted equally in the calculation of S. Deviations in the positive direction indicate
an excess of middle-frequency SNPs (i around n/2) and deviations in the negative
direction indicate either an excess of low-frequency SNPs (i close to 1) or an excess
of high-frequency SNPs (i close to n − 1). Tajima’s D is sometimes portrayed
as a test for selection (see Chap. 4), but in fact, it is sensitive to a whole battery
of nonselective deviations from the standard neutral model, including population
structure and changes in population size over time.
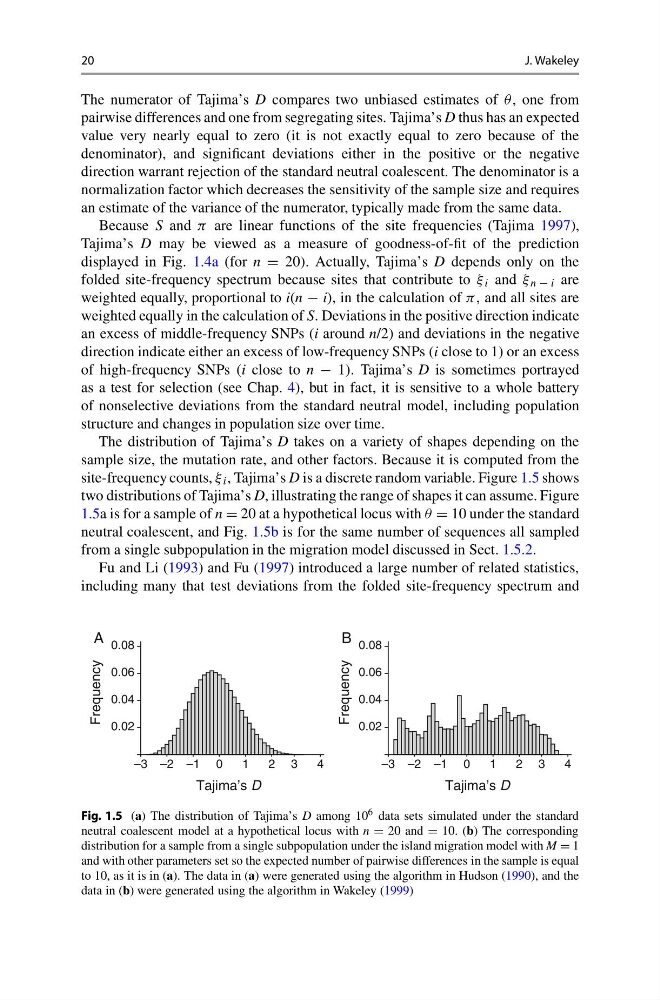
The distribution of Tajima’s D takes on a variety of shapes depending on the
sample size, the mutation rate, and other factors. Because it is computed from the
site-frequency counts, ξ i , Tajima’s D is a discrete random variable. Figure 1.5 shows
two distributions of Tajima’s D, illustrating the range of shapes it can assume. Figure
1.5a is for a sample of n = 20 at a hypothetical locus with θ = 10 under the standard
neutral coalescent, and Fig. 1.5b is for the same number of sequences all sampled
from a single subpopulation in the migration model discussed in Sect. 1.5.2.
Fu and Li (1993) and Fu (1997) introduced a large number of related statistics,
including many that test deviations from the folded site-frequency spectrum and
Tajima’s D
Tajima’s D
Frequency
Frequency
A
B
–3 –2 –1 0
1
2 3
4
0.02
0.04
0.06
0.08
–3 –2 –1 0
1
2 3
4
0.02
0.04
0.06
0.08
Fig. 1.5 (a) The distribution of Tajima’s D among 10 6 data sets simulated under the standard
neutral coalescent model at a hypothetical locus with n = 20 and = 10. (b) The corresponding
distribution for a sample from a single subpopulation under the island migration model with M = 1
and with other parameters set so the expected number of pairwise differences in the sample is equal
to 10, as it is in (a). The data in (a) were generated using the algorithm in Hudson (1990), and the
data in (b) were generated using the algorithm in Wakeley (1999)
J. Wakeley
The numerator of Tajima’s D compares two unbiased estimates of θ , one from
pairwise differences and one from segregating sites. Tajima’s D thus has an expected
value very nearly equal to zero (it is not exactly equal to zero because of the
denominator), and significant deviations either in the positive or the negative
direction warrant rejection of the standard neutral coalescent. The denominator is a
normalization factor which decreases the sensitivity of the sample size and requires
an estimate of the variance of the numerator, typically made from the same data.
Because S and π are linear functions of the site frequencies (Tajima 1997),
Tajima’s D may be viewed as a measure of goodness-of-fit of the prediction
displayed in Fig. 1.4a (for n = 20). Actually, Tajima’s D depends only on the
folded site-frequency spectrum because sites that contribute to ξ i and ξ n − i are
weighted equally, proportional to i(n − i), in the calculation of π, and all sites are
weighted equally in the calculation of S. Deviations in the positive direction indicate
an excess of middle-frequency SNPs (i around n/2) and deviations in the negative
direction indicate either an excess of low-frequency SNPs (i close to 1) or an excess
of high-frequency SNPs (i close to n − 1). Tajima’s D is sometimes portrayed
as a test for selection (see Chap. 4), but in fact, it is sensitive to a whole battery
of nonselective deviations from the standard neutral model, including population
structure and changes in population size over time.
The distribution of Tajima’s D takes on a variety of shapes depending on the
sample size, the mutation rate, and other factors. Because it is computed from the
site-frequency counts, ξ i , Tajima’s D is a discrete random variable. Figure 1.5 shows
two distributions of Tajima’s D, illustrating the range of shapes it can assume. Figure
1.5a is for a sample of n = 20 at a hypothetical locus with θ = 10 under the standard
neutral coalescent, and Fig. 1.5b is for the same number of sequences all sampled
from a single subpopulation in the migration model discussed in Sect. 1.5.2.
Fu and Li (1993) and Fu (1997) introduced a large number of related statistics,
including many that test deviations from the folded site-frequency spectrum and
Tajima’s D
Tajima’s D
Frequency
Frequency
A
B
–3 –2 –1 0
1
2 3
4
0.02
0.04
0.06
0.08
–3 –2 –1 0
1
2 3
4
0.02
0.04
0.06
0.08
Fig. 1.5 (a) The distribution of Tajima’s D among 10 6 data sets simulated under the standard
neutral coalescent model at a hypothetical locus with n = 20 and = 10. (b) The corresponding
distribution for a sample from a single subpopulation under the island migration model with M = 1
and with other parameters set so the expected number of pairwise differences in the sample is equal
to 10, as it is in (a). The data in (a) were generated using the algorithm in Hudson (1990), and the
data in (b) were generated using the algorithm in Wakeley (1999)