

1 Coalescent Models
19
1 3 5 7 9 11 13 15 17 19
0.1
0.2
0.3
1 3 5 7 9 11 13 15 17 19
0.1
0.2
0.3
0.4
0.5
0.6
1 3 5 7 9 11 13 15 17 19
0.1
0.2
0.3
1 3 5 7 9 11 13 15 17 19
0.1
0.2
0.3
Mutant count
Mutant count
Mutant count
Mutant count
Proportion of SNPs
Proportion of SNPs
Proportion of SNPs
Proportion of SNPs
A
B
C
D
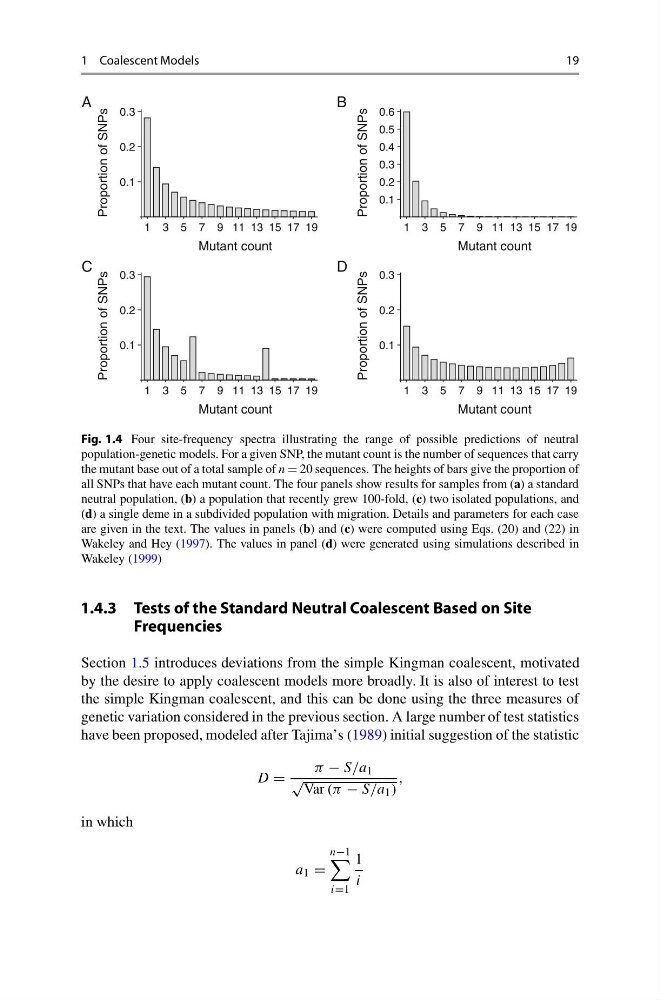
Fig. 1.4 Four site-frequency spectra illustrating the range of possible predictions of neutral
population-genetic models. For a given SNP, the mutant count is the number of sequences that carry
the mutant base out of a total sample of n = 20 sequences. The heights of bars give the proportion of
all SNPs that have each mutant count. The four panels show results for samples from (a) a standard
neutral population, (b) a population that recently grew 100-fold, (c) two isolated populations, and
(d) a single deme in a subdivided population with migration. Details and parameters for each case
are given in the text. The values in panels (b) and (c) were computed using Eqs. (20) and (22) in
Wakeley and Hey (1997). The values in panel (d) were generated using simulations described in
Wakeley (1999)
1.4.3 Tests of the Standard Neutral Coalescent Based on Site
Frequencies
Section 1.5 introduces deviations from the simple Kingman coalescent, motivated
by the desire to apply coalescent models more broadly. It is also of interest to test
the simple Kingman coalescent, and this can be done using the three measures of
genetic variation considered in the previous section. A large number of test statistics
have been proposed, modeled after Tajima’s (1989) initial suggestion of the statistic
D =
π − S/a 1
√
Var (π − S/a 1 )
,
in which
a 1 =
n−1
i=1
1
i
19
1 3 5 7 9 11 13 15 17 19
0.1
0.2
0.3
1 3 5 7 9 11 13 15 17 19
0.1
0.2
0.3
0.4
0.5
0.6
1 3 5 7 9 11 13 15 17 19
0.1
0.2
0.3
1 3 5 7 9 11 13 15 17 19
0.1
0.2
0.3
Mutant count
Mutant count
Mutant count
Mutant count
Proportion of SNPs
Proportion of SNPs
Proportion of SNPs
Proportion of SNPs
A
B
C
D
Fig. 1.4 Four site-frequency spectra illustrating the range of possible predictions of neutral
population-genetic models. For a given SNP, the mutant count is the number of sequences that carry
the mutant base out of a total sample of n = 20 sequences. The heights of bars give the proportion of
all SNPs that have each mutant count. The four panels show results for samples from (a) a standard
neutral population, (b) a population that recently grew 100-fold, (c) two isolated populations, and
(d) a single deme in a subdivided population with migration. Details and parameters for each case
are given in the text. The values in panels (b) and (c) were computed using Eqs. (20) and (22) in
Wakeley and Hey (1997). The values in panel (d) were generated using simulations described in
Wakeley (1999)
1.4.3 Tests of the Standard Neutral Coalescent Based on Site
Frequencies
Section 1.5 introduces deviations from the simple Kingman coalescent, motivated
by the desire to apply coalescent models more broadly. It is also of interest to test
the simple Kingman coalescent, and this can be done using the three measures of
genetic variation considered in the previous section. A large number of test statistics
have been proposed, modeled after Tajima’s (1989) initial suggestion of the statistic
D =
π − S/a 1
√
Var (π − S/a 1 )
,
in which
a 1 =
n−1
i=1
1
i