

6 Identity by Descent in the Mapping of Genetic Traits
135
marker with k alleles (k > 2), we will denote the alleles by v i and the population
frequencies by q i (
k
i=1 q i = 1). It is assumed that appropriate allele frequencies
are known from population databases or other sources.
The basic premise is that IBD DNA is of the same allelic type and that nonIBD DNA copies are of independent allelic type. Mutations may cause IBD DNA
to differ in allelic type, but the probability of mutation is generally much less than
of typing error. We consider typing error in Sect. 6.2.4. The independence of nonIBD and the appropriate population allele frequencies are harder issues, since both
depend on the frame of reference. If IBD is measured relative to a particular timepoint or ancestral population, then it is the allele frequencies in that population
that govern the probability that a set of IBD gametes has each the given allelic
type. However, these allele frequencies are generally unknown, and instead current
population estimates are used. IBD is more reliably inferred using only common
genetic variants, for which population allele frequencies are more easily estimated
and more stable over time.
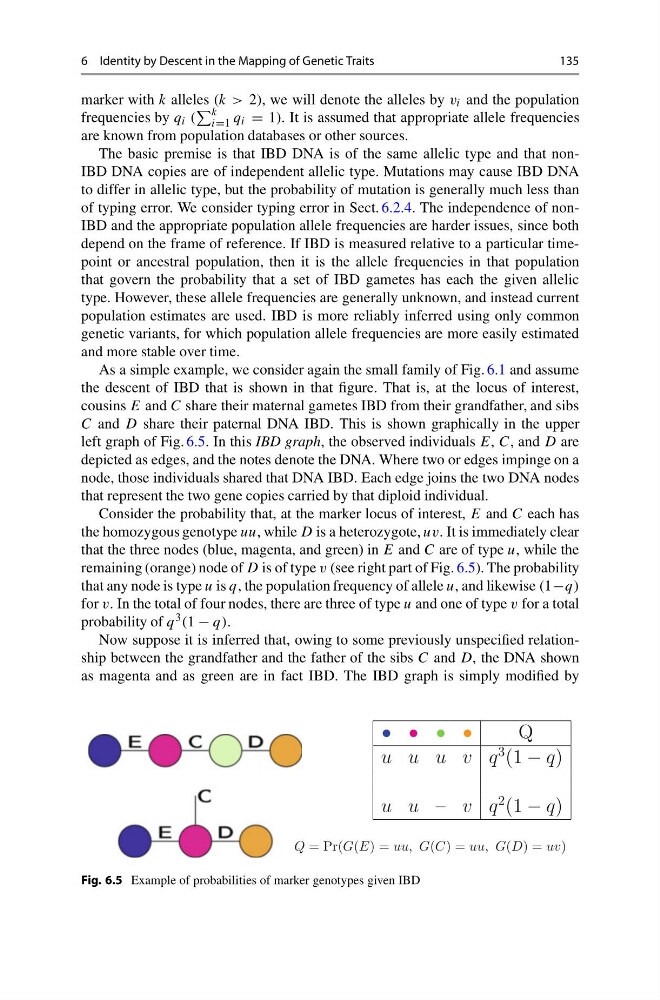
As a simple example, we consider again the small family of Fig. 6.1 and assume
the descent of IBD that is shown in that figure. That is, at the locus of interest,
cousins E and C share their maternal gametes IBD from their grandfather, and sibs
C and D share their paternal DNA IBD. This is shown graphically in the upper
left graph of Fig. 6.5. In this IBD graph, the observed individuals E, C, and D are
depicted as edges, and the notes denote the DNA. Where two or edges impinge on a
node, those individuals shared that DNA IBD. Each edge joins the two DNA nodes
that represent the two gene copies carried by that diploid individual.
Consider the probability that, at the marker locus of interest, E and C each has
the homozygous genotype uu, while D is a heterozygote, uv. It is immediately clear
that the three nodes (blue, magenta, and green) in E and C are of type u, while the
remaining (orange) node of D is of type v (see right part of Fig. 6.5). The probability
that any node is type u is q, the population frequency of allele u, and likewise (1−q)
for v. In the total of four nodes, there are three of type u and one of type v for a total
probability of q 3 (1 − q).
Now suppose it is inferred that, owing to some previously unspecified relationship between the grandfather and the father of the sibs C and D, the DNA shown
as magenta and as green are in fact IBD. The IBD graph is simply modified by
• • • •
Q
u u u v q
3
(1 − q)
u u – v q
2
(1 − q)
Q = Pr(G(E) = uu, G(C) = uu, G(D) = uv)
Fig. 6.5 Example of probabilities of marker genotypes given IBD
135
marker with k alleles (k > 2), we will denote the alleles by v i and the population
frequencies by q i (
k
i=1 q i = 1). It is assumed that appropriate allele frequencies
are known from population databases or other sources.
The basic premise is that IBD DNA is of the same allelic type and that nonIBD DNA copies are of independent allelic type. Mutations may cause IBD DNA
to differ in allelic type, but the probability of mutation is generally much less than
of typing error. We consider typing error in Sect. 6.2.4. The independence of nonIBD and the appropriate population allele frequencies are harder issues, since both
depend on the frame of reference. If IBD is measured relative to a particular timepoint or ancestral population, then it is the allele frequencies in that population
that govern the probability that a set of IBD gametes has each the given allelic
type. However, these allele frequencies are generally unknown, and instead current
population estimates are used. IBD is more reliably inferred using only common
genetic variants, for which population allele frequencies are more easily estimated
and more stable over time.
As a simple example, we consider again the small family of Fig. 6.1 and assume
the descent of IBD that is shown in that figure. That is, at the locus of interest,
cousins E and C share their maternal gametes IBD from their grandfather, and sibs
C and D share their paternal DNA IBD. This is shown graphically in the upper
left graph of Fig. 6.5. In this IBD graph, the observed individuals E, C, and D are
depicted as edges, and the notes denote the DNA. Where two or edges impinge on a
node, those individuals shared that DNA IBD. Each edge joins the two DNA nodes
that represent the two gene copies carried by that diploid individual.
Consider the probability that, at the marker locus of interest, E and C each has
the homozygous genotype uu, while D is a heterozygote, uv. It is immediately clear
that the three nodes (blue, magenta, and green) in E and C are of type u, while the
remaining (orange) node of D is of type v (see right part of Fig. 6.5). The probability
that any node is type u is q, the population frequency of allele u, and likewise (1−q)
for v. In the total of four nodes, there are three of type u and one of type v for a total
probability of q 3 (1 − q).
Now suppose it is inferred that, owing to some previously unspecified relationship between the grandfather and the father of the sibs C and D, the DNA shown
as magenta and as green are in fact IBD. The IBD graph is simply modified by
• • • •
Q
u u u v q
3
(1 − q)
u u – v q
2
(1 − q)
Q = Pr(G(E) = uu, G(C) = uu, G(D) = uv)
Fig. 6.5 Example of probabilities of marker genotypes given IBD