

1 Coalescent Models
5
01001010101
10100100010
10100000010
10010001010
T 4
T 3
T 2
MRCA
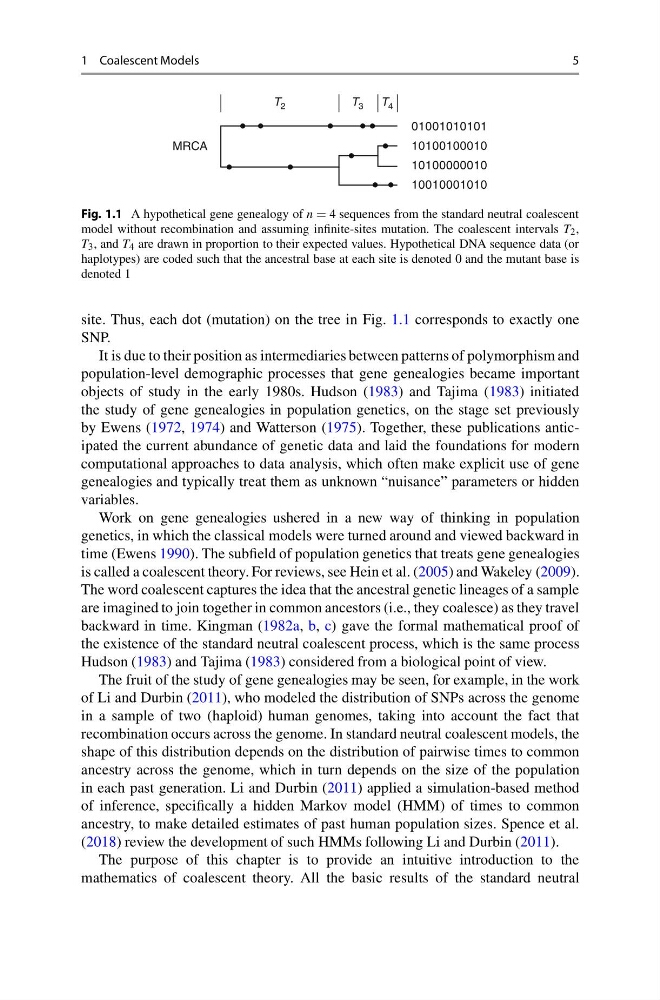
Fig. 1.1 A hypothetical gene genealogy of n = 4 sequences from the standard neutral coalescent
model without recombination and assuming infinite-sites mutation. The coalescent intervals T 2 ,
T 3 , and T 4 are drawn in proportion to their expected values. Hypothetical DNA sequence data (or
haplotypes) are coded such that the ancestral base at each site is denoted 0 and the mutant base is
denoted 1
site. Thus, each dot (mutation) on the tree in Fig. 1.1 corresponds to exactly one
SNP.
It is due to their position as intermediaries between patterns of polymorphism and
population-level demographic processes that gene genealogies became important
objects of study in the early 1980s. Hudson (1983) and Tajima (1983) initiated
the study of gene genealogies in population genetics, on the stage set previously
by Ewens (1972, 1974) and Watterson (1975). Together, these publications anticipated the current abundance of genetic data and laid the foundations for modern
computational approaches to data analysis, which often make explicit use of gene
genealogies and typically treat them as unknown “nuisance” parameters or hidden
variables.
Work on gene genealogies ushered in a new way of thinking in population
genetics, in which the classical models were turned around and viewed backward in
time (Ewens 1990). The subfield of population genetics that treats gene genealogies
is called a coalescent theory. For reviews, see Hein et al. (2005) and Wakeley (2009).
The word coalescent captures the idea that the ancestral genetic lineages of a sample
are imagined to join together in common ancestors (i.e., they coalesce) as they travel
backward in time. Kingman (1982a, b, c) gave the formal mathematical proof of
the existence of the standard neutral coalescent process, which is the same process
Hudson (1983) and Tajima (1983) considered from a biological point of view.
The fruit of the study of gene genealogies may be seen, for example, in the work
of Li and Durbin (2011), who modeled the distribution of SNPs across the genome
in a sample of two (haploid) human genomes, taking into account the fact that
recombination occurs across the genome. In standard neutral coalescent models, the
shape of this distribution depends on the distribution of pairwise times to common
ancestry across the genome, which in turn depends on the size of the population
in each past generation. Li and Durbin (2011) applied a simulation-based method
of inference, specifically a hidden Markov model (HMM) of times to common
ancestry, to make detailed estimates of past human population sizes. Spence et al.
(2018) review the development of such HMMs following Li and Durbin (2011).
The purpose of this chapter is to provide an intuitive introduction to the
mathematics of coalescent theory. All the basic results of the standard neutral
5
01001010101
10100100010
10100000010
10010001010
T 4
T 3
T 2
MRCA
Fig. 1.1 A hypothetical gene genealogy of n = 4 sequences from the standard neutral coalescent
model without recombination and assuming infinite-sites mutation. The coalescent intervals T 2 ,
T 3 , and T 4 are drawn in proportion to their expected values. Hypothetical DNA sequence data (or
haplotypes) are coded such that the ancestral base at each site is denoted 0 and the mutant base is
denoted 1
site. Thus, each dot (mutation) on the tree in Fig. 1.1 corresponds to exactly one
SNP.
It is due to their position as intermediaries between patterns of polymorphism and
population-level demographic processes that gene genealogies became important
objects of study in the early 1980s. Hudson (1983) and Tajima (1983) initiated
the study of gene genealogies in population genetics, on the stage set previously
by Ewens (1972, 1974) and Watterson (1975). Together, these publications anticipated the current abundance of genetic data and laid the foundations for modern
computational approaches to data analysis, which often make explicit use of gene
genealogies and typically treat them as unknown “nuisance” parameters or hidden
variables.
Work on gene genealogies ushered in a new way of thinking in population
genetics, in which the classical models were turned around and viewed backward in
time (Ewens 1990). The subfield of population genetics that treats gene genealogies
is called a coalescent theory. For reviews, see Hein et al. (2005) and Wakeley (2009).
The word coalescent captures the idea that the ancestral genetic lineages of a sample
are imagined to join together in common ancestors (i.e., they coalesce) as they travel
backward in time. Kingman (1982a, b, c) gave the formal mathematical proof of
the existence of the standard neutral coalescent process, which is the same process
Hudson (1983) and Tajima (1983) considered from a biological point of view.
The fruit of the study of gene genealogies may be seen, for example, in the work
of Li and Durbin (2011), who modeled the distribution of SNPs across the genome
in a sample of two (haploid) human genomes, taking into account the fact that
recombination occurs across the genome. In standard neutral coalescent models, the
shape of this distribution depends on the distribution of pairwise times to common
ancestry across the genome, which in turn depends on the size of the population
in each past generation. Li and Durbin (2011) applied a simulation-based method
of inference, specifically a hidden Markov model (HMM) of times to common
ancestry, to make detailed estimates of past human population sizes. Spence et al.
(2018) review the development of such HMMs following Li and Durbin (2011).
The purpose of this chapter is to provide an intuitive introduction to the
mathematics of coalescent theory. All the basic results of the standard neutral