

5 Methods for Association Studies
107
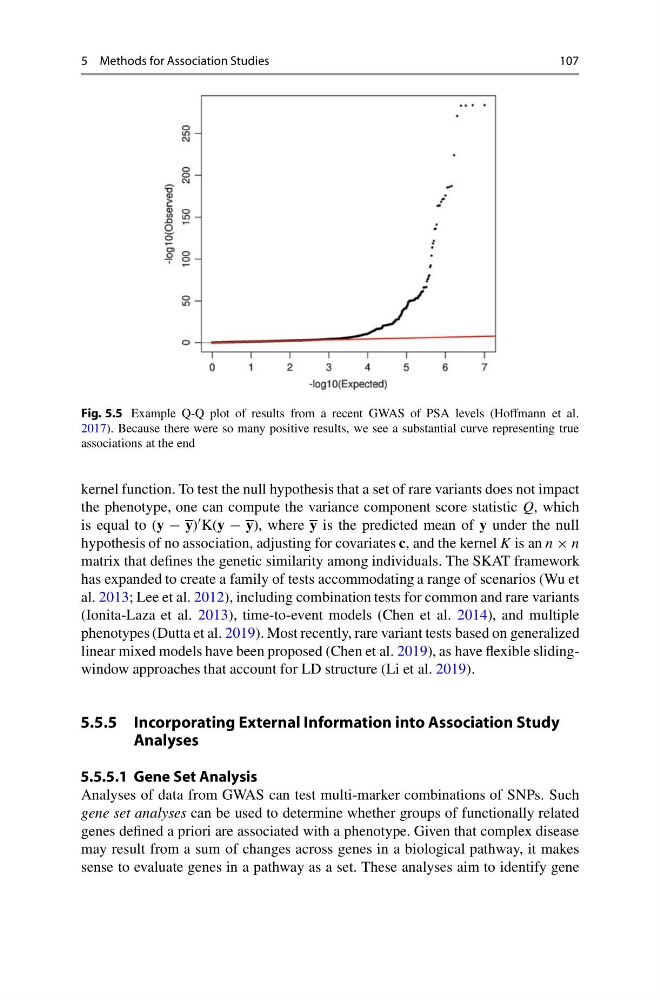
Fig. 5.5 Example Q-Q plot of results from a recent GWAS of PSA levels (Hoffmann et al.
2017). Because there were so many positive results, we see a substantial curve representing true
associations at the end
kernel function. To test the null hypothesis that a set of rare variants does not impact
the phenotype, one can compute the variance component score statistic Q, which
is equal to (y − y) K(y − y), where y is the predicted mean of y under the null
hypothesis of no association, adjusting for covariates c, and the kernel K is an n × n
matrix that defines the genetic similarity among individuals. The SKAT framework
has expanded to create a family of tests accommodating a range of scenarios (Wu et
al. 2013; Lee et al. 2012), including combination tests for common and rare variants
(Ionita-Laza et al. 2013), time-to-event models (Chen et al. 2014), and multiple
phenotypes (Dutta et al. 2019). Most recently, rare variant tests based on generalized
linear mixed models have been proposed (Chen et al. 2019), as have flexible slidingwindow approaches that account for LD structure (Li et al. 2019).
5.5.5 Incorporating External Information into Association Study
Analyses
5.5.5.1 Gene Set Analysis
Analyses of data from GWAS can test multi-marker combinations of SNPs. Such
gene set analyses can be used to determine whether groups of functionally related
genes defined a priori are associated with a phenotype. Given that complex disease
may result from a sum of changes across genes in a biological pathway, it makes
sense to evaluate genes in a pathway as a set. These analyses aim to identify gene
107
Fig. 5.5 Example Q-Q plot of results from a recent GWAS of PSA levels (Hoffmann et al.
2017). Because there were so many positive results, we see a substantial curve representing true
associations at the end
kernel function. To test the null hypothesis that a set of rare variants does not impact
the phenotype, one can compute the variance component score statistic Q, which
is equal to (y − y) K(y − y), where y is the predicted mean of y under the null
hypothesis of no association, adjusting for covariates c, and the kernel K is an n × n
matrix that defines the genetic similarity among individuals. The SKAT framework
has expanded to create a family of tests accommodating a range of scenarios (Wu et
al. 2013; Lee et al. 2012), including combination tests for common and rare variants
(Ionita-Laza et al. 2013), time-to-event models (Chen et al. 2014), and multiple
phenotypes (Dutta et al. 2019). Most recently, rare variant tests based on generalized
linear mixed models have been proposed (Chen et al. 2019), as have flexible slidingwindow approaches that account for LD structure (Li et al. 2019).
5.5.5 Incorporating External Information into Association Study
Analyses
5.5.5.1 Gene Set Analysis
Analyses of data from GWAS can test multi-marker combinations of SNPs. Such
gene set analyses can be used to determine whether groups of functionally related
genes defined a priori are associated with a phenotype. Given that complex disease
may result from a sum of changes across genes in a biological pathway, it makes
sense to evaluate genes in a pathway as a set. These analyses aim to identify gene