

106
R. E. Graff et al.
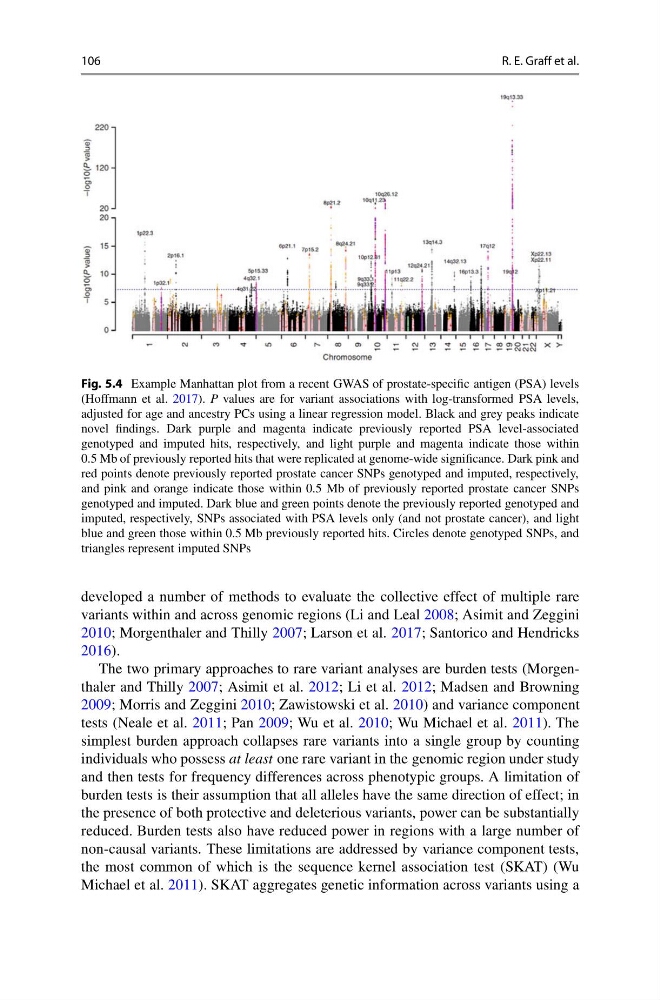
Fig. 5.4 Example Manhattan plot from a recent GWAS of prostate-specific antigen (PSA) levels
(Hoffmann et al. 2017). P values are for variant associations with log-transformed PSA levels,
adjusted for age and ancestry PCs using a linear regression model. Black and grey peaks indicate
novel findings. Dark purple and magenta indicate previously reported PSA level-associated
genotyped and imputed hits, respectively, and light purple and magenta indicate those within
0.5 Mb of previously reported hits that were replicated at genome-wide significance. Dark pink and
red points denote previously reported prostate cancer SNPs genotyped and imputed, respectively,
and pink and orange indicate those within 0.5 Mb of previously reported prostate cancer SNPs
genotyped and imputed. Dark blue and green points denote the previously reported genotyped and
imputed, respectively, SNPs associated with PSA levels only (and not prostate cancer), and light
blue and green those within 0.5 Mb previously reported hits. Circles denote genotyped SNPs, and
triangles represent imputed SNPs
developed a number of methods to evaluate the collective effect of multiple rare
variants within and across genomic regions (Li and Leal 2008; Asimit and Zeggini
2010; Morgenthaler and Thilly 2007; Larson et al. 2017; Santorico and Hendricks
2016).
The two primary approaches to rare variant analyses are burden tests (Morgenthaler and Thilly 2007; Asimit et al. 2012; Li et al. 2012; Madsen and Browning
2009; Morris and Zeggini 2010; Zawistowski et al. 2010) and variance component
tests (Neale et al. 2011; Pan 2009; Wu et al. 2010; Wu Michael et al. 2011). The
simplest burden approach collapses rare variants into a single group by counting
individuals who possess at least one rare variant in the genomic region under study
and then tests for frequency differences across phenotypic groups. A limitation of
burden tests is their assumption that all alleles have the same direction of effect; in
the presence of both protective and deleterious variants, power can be substantially
reduced. Burden tests also have reduced power in regions with a large number of
non-causal variants. These limitations are addressed by variance component tests,
the most common of which is the sequence kernel association test (SKAT) (Wu
Michael et al. 2011). SKAT aggregates genetic information across variants using a
R. E. Graff et al.
Fig. 5.4 Example Manhattan plot from a recent GWAS of prostate-specific antigen (PSA) levels
(Hoffmann et al. 2017). P values are for variant associations with log-transformed PSA levels,
adjusted for age and ancestry PCs using a linear regression model. Black and grey peaks indicate
novel findings. Dark purple and magenta indicate previously reported PSA level-associated
genotyped and imputed hits, respectively, and light purple and magenta indicate those within
0.5 Mb of previously reported hits that were replicated at genome-wide significance. Dark pink and
red points denote previously reported prostate cancer SNPs genotyped and imputed, respectively,
and pink and orange indicate those within 0.5 Mb of previously reported prostate cancer SNPs
genotyped and imputed. Dark blue and green points denote the previously reported genotyped and
imputed, respectively, SNPs associated with PSA levels only (and not prostate cancer), and light
blue and green those within 0.5 Mb previously reported hits. Circles denote genotyped SNPs, and
triangles represent imputed SNPs
developed a number of methods to evaluate the collective effect of multiple rare
variants within and across genomic regions (Li and Leal 2008; Asimit and Zeggini
2010; Morgenthaler and Thilly 2007; Larson et al. 2017; Santorico and Hendricks
2016).
The two primary approaches to rare variant analyses are burden tests (Morgenthaler and Thilly 2007; Asimit et al. 2012; Li et al. 2012; Madsen and Browning
2009; Morris and Zeggini 2010; Zawistowski et al. 2010) and variance component
tests (Neale et al. 2011; Pan 2009; Wu et al. 2010; Wu Michael et al. 2011). The
simplest burden approach collapses rare variants into a single group by counting
individuals who possess at least one rare variant in the genomic region under study
and then tests for frequency differences across phenotypic groups. A limitation of
burden tests is their assumption that all alleles have the same direction of effect; in
the presence of both protective and deleterious variants, power can be substantially
reduced. Burden tests also have reduced power in regions with a large number of
non-causal variants. These limitations are addressed by variance component tests,
the most common of which is the sequence kernel association test (SKAT) (Wu
Michael et al. 2011). SKAT aggregates genetic information across variants using a