

Reducing Greenhouse Gas Emissions and Improving Air Quality
26
26
correspondingly increasing. Most megacities have annual average values
of PM2.5 that exceed the WHO guideline value of 10 µg/ m
3
– for example,
values of 55 for Beijing, 66 for Cairo, 13 for Chicago, 170 for Delhi, and 19 for
Los Angeles have been reported (Erickson et al., 2017; Erickson and Jennings,
2017; Krzyzanowski et al., 2014). Tokyo is one of the largest megacities, with
a population of about 38 million in 2016 (UN, 2016) and an average annual
PM2.5 value of about 14 µg/ m
3
(Cheng et al., 2016). According to Cheng
et al. (2016), the largest values of PM2.5 are in Delhi (143), Cairo (109.6), Xi’an
(102.2), Tianjin (95.7), and Chengdu (89.4). The smallest values are in Miami
(6.7), Toronto (8.4), New York (9.1), Madrid (9.8), and Philadelphia (10.3).
These are all average annual values in micrograms per cubic meter for cities
with a population of 5 million or more. For 338 big cities in China with PM2.5
data, annual average values range from 11– 125 µg/ m
3
in 2015 and from 12–
158 µg/ m
3
in 2016; the average value for all of these cities was 50 µg/ m
3
in
2015 and 47 µg/ m
3
in 2016 (Lin et al., 2018). In China, the combustion of
coal is the source of 46% of the PM2.5 in summer and 35% in the winter (Ma
et al., 2017).
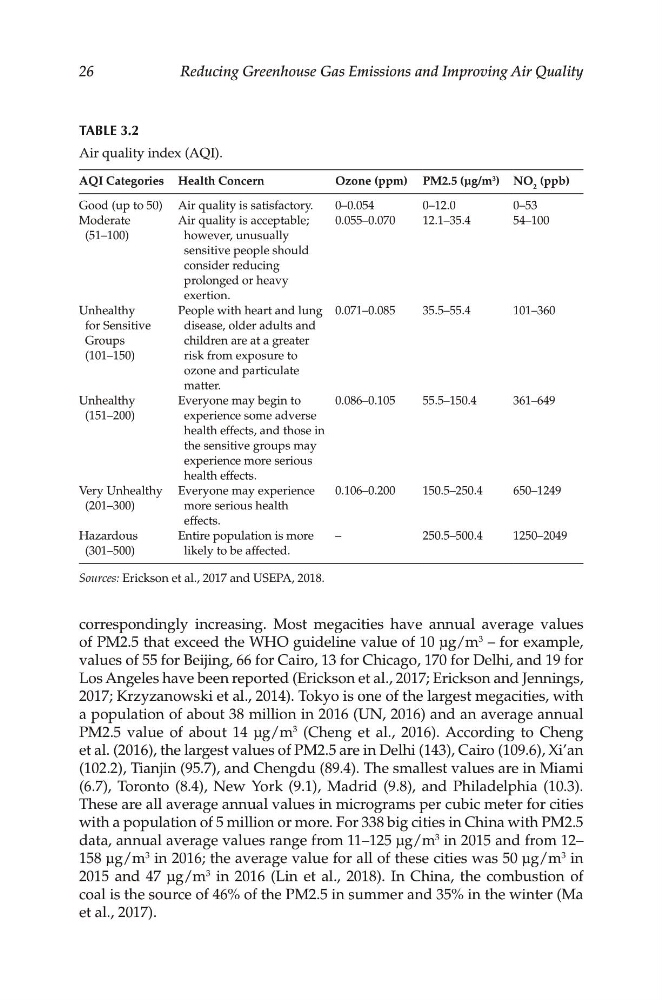
TABLE 3.2
Air quality index (AQI).
AQI Categories Health Concern
Ozone (ppm) PM2.5 (µg/ m
3 ) NO 2 (ppb)
Good (up to 50) Air quality is satisfactory.
0– 0.054
0– 12.0
0– 53
Moderate
(51– 100)
Air quality is acceptable;
however, unusually
sensitive people should
consider reducing
prolonged or heavy
exertion.
0.055– 0.070
12.1– 35.4
54– 100
Unhealthy
for Sensitive
Groups
(101– 150)
People with heart and lung
disease, older adults and
children are at a greater
risk from exposure to
ozone and particulate
matter.
0.071– 0.085
35.5– 55.4
101– 360
Unhealthy
(151– 200)
Everyone may begin to
experience some adverse
health effects, and those in
the sensitive groups may
experience more serious
health effects.
0.086– 0.105
55.5– 150.4
361– 649
Very Unhealthy
(201– 300)
Everyone may experience
more serious health
effects.
0.106– 0.200
150.5– 250.4
650– 1249
Hazardous
(301– 500)
Entire population is more
likely to be affected.
–
250.5– 500.4
1250– 2049
Sources: Erickson et al., 2017 and USEPA, 2018.
26
26
correspondingly increasing. Most megacities have annual average values
of PM2.5 that exceed the WHO guideline value of 10 µg/ m
3
– for example,
values of 55 for Beijing, 66 for Cairo, 13 for Chicago, 170 for Delhi, and 19 for
Los Angeles have been reported (Erickson et al., 2017; Erickson and Jennings,
2017; Krzyzanowski et al., 2014). Tokyo is one of the largest megacities, with
a population of about 38 million in 2016 (UN, 2016) and an average annual
PM2.5 value of about 14 µg/ m
3
(Cheng et al., 2016). According to Cheng
et al. (2016), the largest values of PM2.5 are in Delhi (143), Cairo (109.6), Xi’an
(102.2), Tianjin (95.7), and Chengdu (89.4). The smallest values are in Miami
(6.7), Toronto (8.4), New York (9.1), Madrid (9.8), and Philadelphia (10.3).
These are all average annual values in micrograms per cubic meter for cities
with a population of 5 million or more. For 338 big cities in China with PM2.5
data, annual average values range from 11– 125 µg/ m
3
in 2015 and from 12–
158 µg/ m
3
in 2016; the average value for all of these cities was 50 µg/ m
3
in
2015 and 47 µg/ m
3
in 2016 (Lin et al., 2018). In China, the combustion of
coal is the source of 46% of the PM2.5 in summer and 35% in the winter (Ma
et al., 2017).
TABLE 3.2
Air quality index (AQI).
AQI Categories Health Concern
Ozone (ppm) PM2.5 (µg/ m
3 ) NO 2 (ppb)
Good (up to 50) Air quality is satisfactory.
0– 0.054
0– 12.0
0– 53
Moderate
(51– 100)
Air quality is acceptable;
however, unusually
sensitive people should
consider reducing
prolonged or heavy
exertion.
0.055– 0.070
12.1– 35.4
54– 100
Unhealthy
for Sensitive
Groups
(101– 150)
People with heart and lung
disease, older adults and
children are at a greater
risk from exposure to
ozone and particulate
matter.
0.071– 0.085
35.5– 55.4
101– 360
Unhealthy
(151– 200)
Everyone may begin to
experience some adverse
health effects, and those in
the sensitive groups may
experience more serious
health effects.
0.086– 0.105
55.5– 150.4
361– 649
Very Unhealthy
(201– 300)
Everyone may experience
more serious health
effects.
0.106– 0.200
150.5– 250.4
650– 1249
Hazardous
(301– 500)
Entire population is more
likely to be affected.
–
250.5– 500.4
1250– 2049
Sources: Erickson et al., 2017 and USEPA, 2018.