

Urban Air Quality
25
25
to protect public health, while the secondary standards protect public
welfare. Damage to plants and animals is also included as part of the secondary standards (USEPA, 2018).
The values in Tables 3.1 and 3.2 are for the United States. The WHO has
a guideline value of 10 micrograms per cubic meter (µg/ m
3
) for the annual
average value of PM2.5. The values of PM2.5 in the air vary with time of day
and location in a city; the WHO value of 10 µg/ m
3
is an annual mean value
(WHO, 2016). There are also air quality standards for the countries of the
European Union (EC, 2017) and for many other countries.
3.2.1 Particulate Matter in Urban Air
Particulate matter in urban air has the greatest health impact among all the
pollutants. The US NAAQS for PM2.5 is 12 µg/ m
3
for the annual average
value. The AQI value is 50 for PM2.5 = 12, which is the transition value
from green (good) to yellow (moderate) for the AQI. When the AQI = 100,
the value of PM2.5 is 35.4, which corresponds to the 24- hour average value
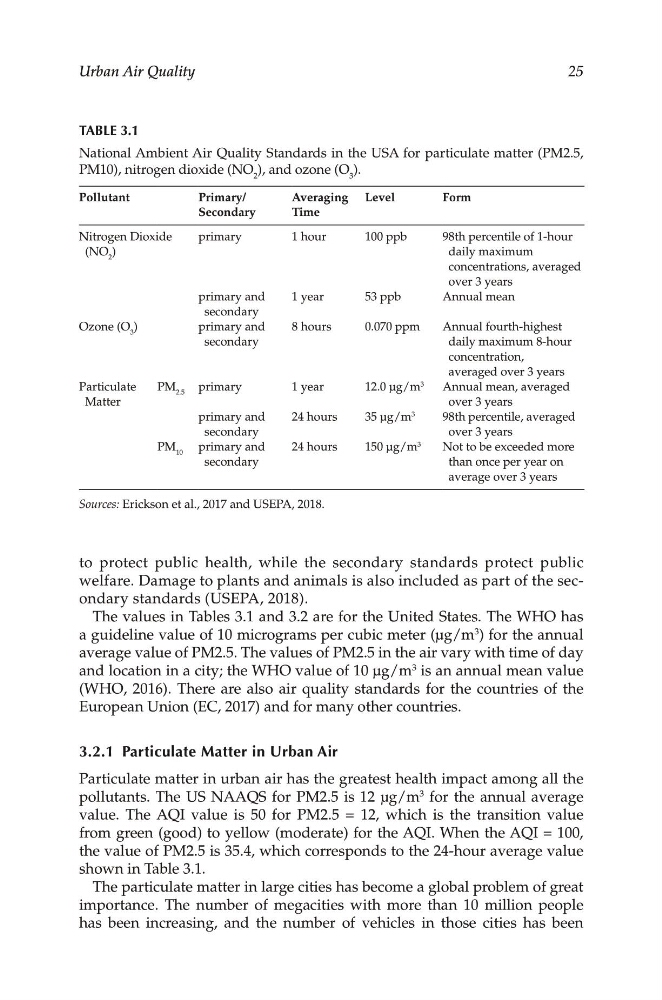
shown in Table 3.1.
The particulate matter in large cities has become a global problem of great
importance. The number of megacities with more than 10 million people
has been increasing, and the number of vehicles in those cities has been
TABLE 3.1
National Ambient Air Quality Standards in the USA for particulate matter (PM2.5,
PM10), nitrogen dioxide (NO 2 ), and ozone (O 3 ).
Pollutant
Primary/
Secondary
Averaging
Time
Level
Form
Nitrogen Dioxide
(NO 2 )
primary
1 hour
100 ppb
98th percentile of 1- hour
daily maximum
concentrations, averaged
over 3 years
primary and
secondary
1 year
53 ppb
Annual mean
Ozone (O 3 )
primary and
secondary
8 hours
0.070 ppm
Annual fourth- highest
daily maximum 8- hour
concentration,
averaged over 3 years
Particulate
Matter
PM 2.5 primary
1 year
12.0 μg/ m
3
Annual mean, averaged
over 3 years
primary and
secondary
24 hours
35 μg/ m
3
98th percentile, averaged
over 3 years
PM 10 primary and
secondary
24 hours
150 μg/ m
3
Not to be exceeded more
than once per year on
average over 3 years
Sources: Erickson et al., 2017 and USEPA, 2018.
25
25
to protect public health, while the secondary standards protect public
welfare. Damage to plants and animals is also included as part of the secondary standards (USEPA, 2018).
The values in Tables 3.1 and 3.2 are for the United States. The WHO has
a guideline value of 10 micrograms per cubic meter (µg/ m
3
) for the annual
average value of PM2.5. The values of PM2.5 in the air vary with time of day
and location in a city; the WHO value of 10 µg/ m
3
is an annual mean value
(WHO, 2016). There are also air quality standards for the countries of the
European Union (EC, 2017) and for many other countries.
3.2.1 Particulate Matter in Urban Air
Particulate matter in urban air has the greatest health impact among all the
pollutants. The US NAAQS for PM2.5 is 12 µg/ m
3
for the annual average
value. The AQI value is 50 for PM2.5 = 12, which is the transition value
from green (good) to yellow (moderate) for the AQI. When the AQI = 100,
the value of PM2.5 is 35.4, which corresponds to the 24- hour average value
shown in Table 3.1.
The particulate matter in large cities has become a global problem of great
importance. The number of megacities with more than 10 million people
has been increasing, and the number of vehicles in those cities has been
TABLE 3.1
National Ambient Air Quality Standards in the USA for particulate matter (PM2.5,
PM10), nitrogen dioxide (NO 2 ), and ozone (O 3 ).
Pollutant
Primary/
Secondary
Averaging
Time
Level
Form
Nitrogen Dioxide
(NO 2 )
primary
1 hour
100 ppb
98th percentile of 1- hour
daily maximum
concentrations, averaged
over 3 years
primary and
secondary
1 year
53 ppb
Annual mean
Ozone (O 3 )
primary and
secondary
8 hours
0.070 ppm
Annual fourth- highest
daily maximum 8- hour
concentration,
averaged over 3 years
Particulate
Matter
PM 2.5 primary
1 year
12.0 μg/ m
3
Annual mean, averaged
over 3 years
primary and
secondary
24 hours
35 μg/ m
3
98th percentile, averaged
over 3 years
PM 10 primary and
secondary
24 hours
150 μg/ m
3
Not to be exceeded more
than once per year on
average over 3 years
Sources: Erickson et al., 2017 and USEPA, 2018.