

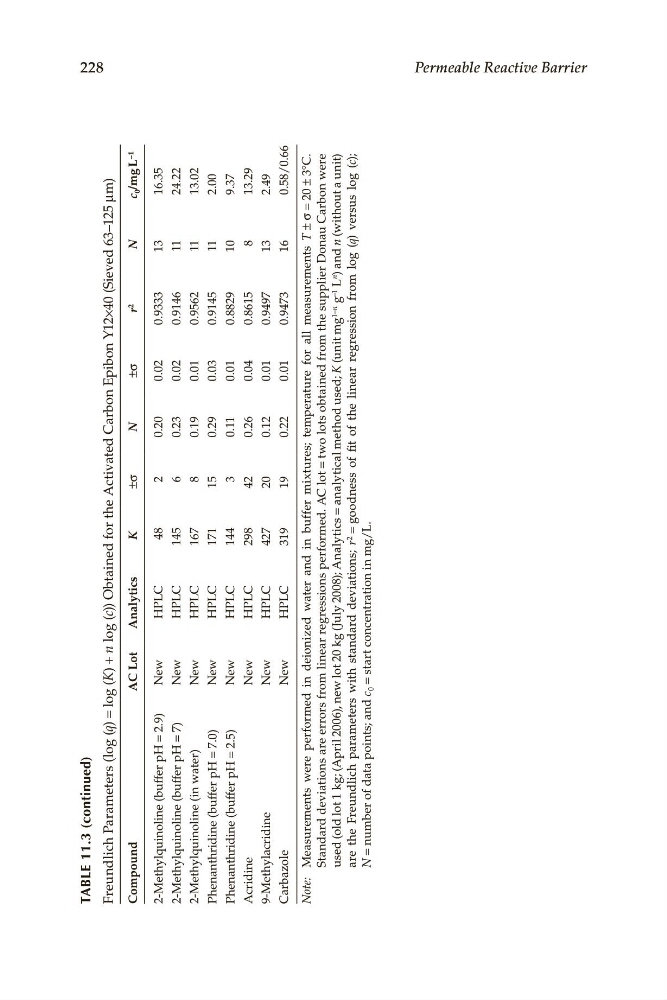
Compound
AC Lot
Analytics
K
±σ
N
±σ
r 2
N
c
0 /mg L −1
2-Methylquinoline (buffer pH
= 2.9)
New
HPLC
48
2
0.20
0.02
0.9333
13
16.35
2-Methylquinoline (buffer pH
= 7)
New
HPLC
145
6
0.23
0.02
0.9146
11
24.22
2-Methylquinoline (in water)
New
HPLC
167
8
0.19
0.01
0.9562
11
13.02
Phenanthridine (buffer pH
= 7.0)
New
HPLC
171
15
0.29
0.03
0.9145
11
2.00
Phenanthridine (buffer pH
= 2.5)
New
HPLC
144
3
0.11
0.01
0.8829
10
9.37
Acridine
New
HPLC
298
42
0.26
0.04
0.8615
8
13.29
9-Methylacridine
New
HPLC
427
20
0.12
0.01
0.9497
13
2.49
Carbazole
New
HPLC
319
19
0.22
0.01
0.9473
16
0.58/0.66
Note:
Measurements were performed in deionized water and in buffer mixtures; temperature for all measurements T
± σ = 20
± 3°C.
Standard deviations are errors from linear regressions performed. AC lot
= two lots obtained from the supplier Donau Carbon were
used (old lot 1 kg; (April 2006), new lot 20 kg (July 2008); Analytics
= analytical method used; K
(unit mg 1−n
g −1
L n
) and n
(without a unit)
are the Freundlich parameters with standard deviations; r 2
= goodness of fi t of the linear regression from log (q) versus log (c);
N
= number of data points; and c
0 = start concentration in mg/L.
228
m)
μ
5
2
1
–
3
d 6
e
ev
i
S
0 (
4
×
2
1
n Y
o
b
i
p
n E
o
rb
a
d C
e
t
a
v
i
t
c
e A
h
r t
o
d f
e
n
i
a
bt
)) O
c
(
g
lo
n
+
)
K
(
g
lo
=
)
q
g (
o
l
)
continued
s (
r
e
t
e
m
a
r
u
ABLE 11.3 (
T
a
h P
c
i
l
d
n
e
r
F
Permeable Reactive Barrier
AC Lot
Analytics
K
±σ
N
±σ
r 2
N
c
0 /mg L −1
2-Methylquinoline (buffer pH
= 2.9)
New
HPLC
48
2
0.20
0.02
0.9333
13
16.35
2-Methylquinoline (buffer pH
= 7)
New
HPLC
145
6
0.23
0.02
0.9146
11
24.22
2-Methylquinoline (in water)
New
HPLC
167
8
0.19
0.01
0.9562
11
13.02
Phenanthridine (buffer pH
= 7.0)
New
HPLC
171
15
0.29
0.03
0.9145
11
2.00
Phenanthridine (buffer pH
= 2.5)
New
HPLC
144
3
0.11
0.01
0.8829
10
9.37
Acridine
New
HPLC
298
42
0.26
0.04
0.8615
8
13.29
9-Methylacridine
New
HPLC
427
20
0.12
0.01
0.9497
13
2.49
Carbazole
New
HPLC
319
19
0.22
0.01
0.9473
16
0.58/0.66
Note:
Measurements were performed in deionized water and in buffer mixtures; temperature for all measurements T
± σ = 20
± 3°C.
Standard deviations are errors from linear regressions performed. AC lot
= two lots obtained from the supplier Donau Carbon were
used (old lot 1 kg; (April 2006), new lot 20 kg (July 2008); Analytics
= analytical method used; K
(unit mg 1−n
g −1
L n
) and n
(without a unit)
are the Freundlich parameters with standard deviations; r 2
= goodness of fi t of the linear regression from log (q) versus log (c);
N
= number of data points; and c
0 = start concentration in mg/L.
228
m)
μ
5
2
1
–
3
d 6
e
ev
i
S
0 (
4
×
2
1
n Y
o
b
i
p
n E
o
rb
a
d C
e
t
a
v
i
t
c
e A
h
r t
o
d f
e
n
i
a
bt
)) O
c
(
g
lo
n
+
)
K
(
g
lo
=
)
q
g (
o
l
)
continued
s (
r
e
t
e
m
a
r
u
ABLE 11.3 (
T
a
h P
c
i
l
d
n
e
r
F
Permeable Reactive Barrier