

146
2004
0
20
40
60
80
100
120
140
2005
TEPA-1C/D
TEPA-2C/D
TEPA-5C/D
TEPA-6C/D
2006
2007
2008
2009
2010
160
DOC (mg/L)
Permeable Reactive Barrier
high enough to effectively remove incoming heavy metals and arsenic from
the groundwater. Interestingly, contrary to the other three transects, calcium
concentrations within the PRB along TEPA-2 increased steadily since 2007,
despite pH remaining relatively constant. This suggests that the limestone
in the PRB along TEPA-2 may have made an increasing contribution to pH
buffering relative to the bicarbonate generated from microbially mediated
sulfate reduction.
As might be expected, the PRB discharges a sulfide plume. The highest
average sulfide concentration measured in H wells near the creek downgradient of the PRBs since 2004 was 1.2 mg/L at TEPA-6. The highest single measurement of sulfide at an H well location was 4.0 m g/L at TEPA-6H in 2007.
8.1.2.9 Dissolved Organic Carbon
DOC concentrations increased significantly within the PRB relative to upgradient locations as expected (Table 8.1). Since installation, the average DOC
concentrations upgradient of the PRB ranged from 4.04 mg/L at TEPA-1 to
16.0 mg/L at TEPA-6. Within the PRB, average DOC concentrations since
installation of the PRB ranged from 19.0 mg/L at TEPA-1 to 69.9 mg/L at
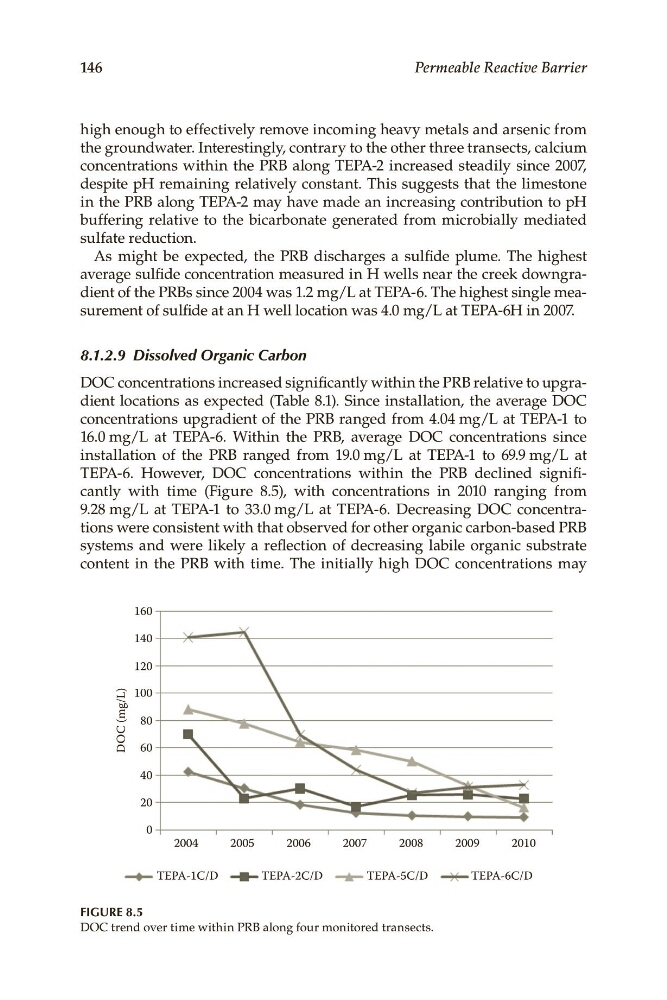
TEPA-6. However, DOC concentrations within the PRB declined significantly with time (Figure 8.5), with concentrations in 2010 ranging from
9.28 mg/L at TEPA-1 to 33.0 mg/L at TEPA-6. Decreasing DOC concentrations were consistent with that observed for other organic carbon-based PRB
systems and were likely a reflection of decreasing labile organic substrate
content in the PRB with time. The initially high DOC concentrations may
FIGURE 8.5
DOC trend over time within PRB along four monitored transects.
2004
0
20
40
60
80
100
120
140
2005
TEPA-1C/D
TEPA-2C/D
TEPA-5C/D
TEPA-6C/D
2006
2007
2008
2009
2010
160
DOC (mg/L)
Permeable Reactive Barrier
high enough to effectively remove incoming heavy metals and arsenic from
the groundwater. Interestingly, contrary to the other three transects, calcium
concentrations within the PRB along TEPA-2 increased steadily since 2007,
despite pH remaining relatively constant. This suggests that the limestone
in the PRB along TEPA-2 may have made an increasing contribution to pH
buffering relative to the bicarbonate generated from microbially mediated
sulfate reduction.
As might be expected, the PRB discharges a sulfide plume. The highest
average sulfide concentration measured in H wells near the creek downgradient of the PRBs since 2004 was 1.2 mg/L at TEPA-6. The highest single measurement of sulfide at an H well location was 4.0 m g/L at TEPA-6H in 2007.
8.1.2.9 Dissolved Organic Carbon
DOC concentrations increased significantly within the PRB relative to upgradient locations as expected (Table 8.1). Since installation, the average DOC
concentrations upgradient of the PRB ranged from 4.04 mg/L at TEPA-1 to
16.0 mg/L at TEPA-6. Within the PRB, average DOC concentrations since
installation of the PRB ranged from 19.0 mg/L at TEPA-1 to 69.9 mg/L at
TEPA-6. However, DOC concentrations within the PRB declined significantly with time (Figure 8.5), with concentrations in 2010 ranging from
9.28 mg/L at TEPA-1 to 33.0 mg/L at TEPA-6. Decreasing DOC concentrations were consistent with that observed for other organic carbon-based PRB
systems and were likely a reflection of decreasing labile organic substrate
content in the PRB with time. The initially high DOC concentrations may
FIGURE 8.5
DOC trend over time within PRB along four monitored transects.