

Sequenced PRB for the Pretreatment of Nitrate and Remediation of TCE
121
undertaken to further investigate the optimal denitrification mix. The following column mixtures were evaluated:
1. 100% Sand
2. 80% Sand and 20% sawdust
3. 60% Sand and 40% sawdust
4. 60% Sand and 40% woodchips
As in the previous phase of testing, a saline tracer test was undertaken first
to assess particle velocity. The laboratory results of this final round of testing
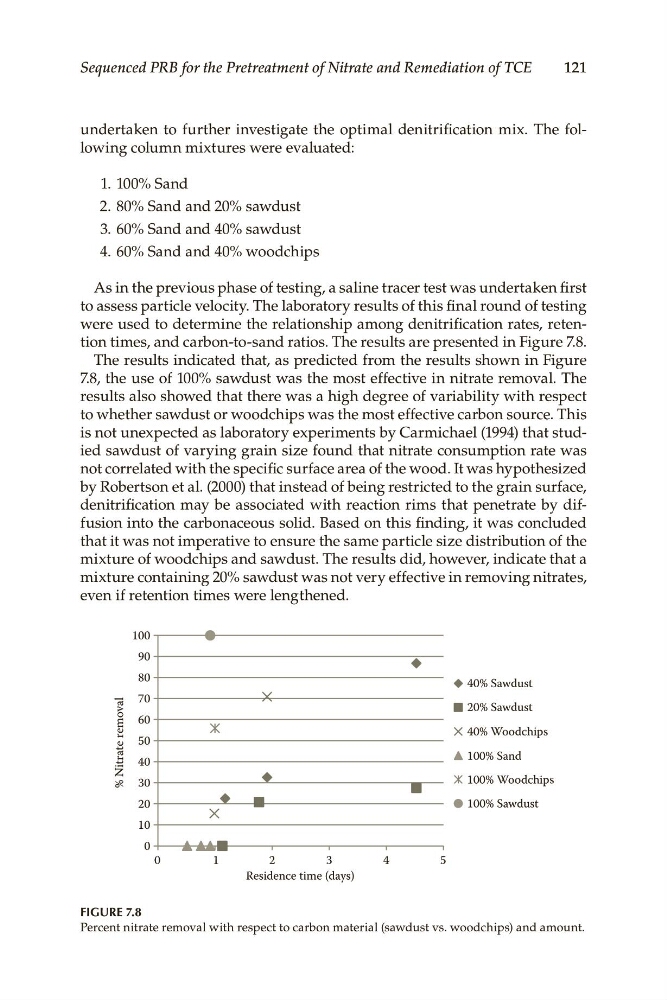
were used to determine the relationship among denitrification rates, retention times, and carbon-to-sand ratios. The results are presented in Figure 7.8.
The results indicated that, as predicted from the results shown in Figure
7.8, the use of 100% sawdust was the most effective in nitrate removal. The
results also showed that there was a high degree of variability with respect
to whether sawdust or woodchips was the most effective carbon source. This
is not unexpected as laboratory experiments by Carmichael (1994) that studied sawdust of varying grain size found that nitrate consumption rate was
not correlated with the specific surface area of the wood. It was hypothesized
by Robertson et al. (2000) that instead of being restricted to the grain surface,
denitrification may be associated with reaction rims that penetrate by diffusion into the carbonaceous solid. Based on this finding, it was concluded
that it was not imperative to ensure the same particle size distribution of the
mixture of woodchips and sawdust. The results did, however, indicate that a
mixture containing 20% sawdust was not very effective in removing nitrates,
even if retention times were lengthened.
40% Sawdust
20% Sawdust
40% Woodchips
100% Sand
100% Woodchips
100% Sawdust
% Nitrate removal
0
10
20
30
40
50
60
70
80
90
100
0
1
2
3
4
5
Residence time (days)
FIGURE 7.8
Percent nitrate removal with respect to carbon material (sawdust vs. woodchips) and amount.
121
undertaken to further investigate the optimal denitrification mix. The following column mixtures were evaluated:
1. 100% Sand
2. 80% Sand and 20% sawdust
3. 60% Sand and 40% sawdust
4. 60% Sand and 40% woodchips
As in the previous phase of testing, a saline tracer test was undertaken first
to assess particle velocity. The laboratory results of this final round of testing
were used to determine the relationship among denitrification rates, retention times, and carbon-to-sand ratios. The results are presented in Figure 7.8.
The results indicated that, as predicted from the results shown in Figure
7.8, the use of 100% sawdust was the most effective in nitrate removal. The
results also showed that there was a high degree of variability with respect
to whether sawdust or woodchips was the most effective carbon source. This
is not unexpected as laboratory experiments by Carmichael (1994) that studied sawdust of varying grain size found that nitrate consumption rate was
not correlated with the specific surface area of the wood. It was hypothesized
by Robertson et al. (2000) that instead of being restricted to the grain surface,
denitrification may be associated with reaction rims that penetrate by diffusion into the carbonaceous solid. Based on this finding, it was concluded
that it was not imperative to ensure the same particle size distribution of the
mixture of woodchips and sawdust. The results did, however, indicate that a
mixture containing 20% sawdust was not very effective in removing nitrates,
even if retention times were lengthened.
40% Sawdust
20% Sawdust
40% Woodchips
100% Sand
100% Woodchips
100% Sawdust
% Nitrate removal
0
10
20
30
40
50
60
70
80
90
100
0
1
2
3
4
5
Residence time (days)
FIGURE 7.8
Percent nitrate removal with respect to carbon material (sawdust vs. woodchips) and amount.