

What is the bioeconomy? 25
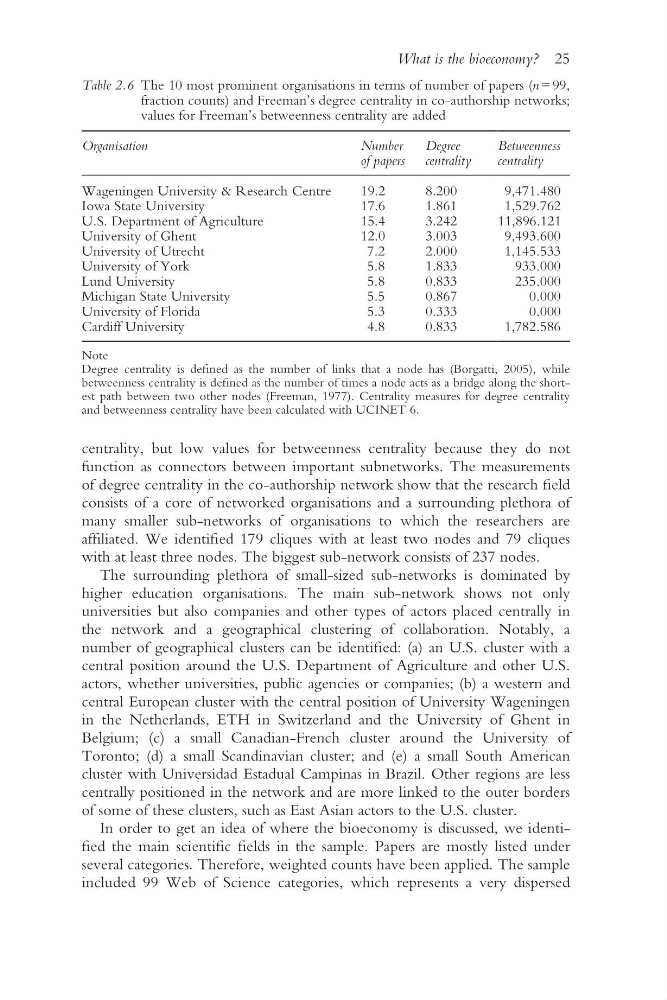
centrality, but low values for betweenness centrality because they do not
function as connectors between important subnetworks. The measurements
of degree centrality in the co- authorship network show that the research field
consists of a core of networked organisations and a surrounding plethora of
many smaller sub- networks of organisations to which the researchers are
affiliated. We identified 179 cliques with at least two nodes and 79 cliques
with at least three nodes. The biggest sub- network consists of 237 nodes.
The surrounding plethora of small- sized sub- networks is dominated by
higher education organisations. The main sub- network shows not only
universities but also companies and other types of actors placed centrally in
the network and a geographical clustering of collaboration. Notably, a
number of geographical clusters can be identified: (a) an U.S. cluster with a
central position around the U.S. Department of Agriculture and other U.S.
actors, whether universities, public agencies or companies; (b) a western and
central European cluster with the central position of University Wageningen
in the Netherlands, ETH in Switzerland and the University of Ghent in
Belgium; (c) a small Canadian- French cluster around the University of
Toronto; (d) a small Scandinavian cluster; and (e) a small South American
cluster with Universidad Estadual Campinas in Brazil. Other regions are less
centrally positioned in the network and are more linked to the outer borders
of some of these clusters, such as East Asian actors to the U.S. cluster.
In order to get an idea of where the bioeconomy is discussed, we identified the main scientific fields in the sample. Papers are mostly listed under
several categories. Therefore, weighted counts have been applied. The sample
included 99 Web of Science categories, which represents a very dispersed
Table 2.6 The 10 most prominent organisations in terms of number of papers (n = 99,
fraction counts) and Freeman’s degree centrality in co-authorship networks;
values for Freeman’s betweenness centrality are added
Organisation
Number
of papers
Degree
centrality
Betweenness
centrality
Wageningen University & Research Centre
19.2
8.200
9,471.480
Iowa State University
17.6
1.861
1,529.762
U.S. Department of Agriculture
15.4
3.242
11,896.121
University of Ghent
12.0
3.003
9,493.600
University of Utrecht
7.2
2.000
1,145.533
University of York
5.8
1.833
933.000
Lund University
5.8
0.833
235.000
Michigan State University
5.5
0.867
0.000
University of Florida
5.3
0.333
0.000
Cardiff University
4.8
0.833
1,782.586
Note
Degree centrality is defined as the number of links that a node has (Borgatti, 2005), while
betweenness centrality is defined as the number of times a node acts as a bridge along the shortest path between two other nodes (Freeman, 1977). Centrality measures for degree centrality
and betweenness centrality have been calculated with UCINET 6.
centrality, but low values for betweenness centrality because they do not
function as connectors between important subnetworks. The measurements
of degree centrality in the co- authorship network show that the research field
consists of a core of networked organisations and a surrounding plethora of
many smaller sub- networks of organisations to which the researchers are
affiliated. We identified 179 cliques with at least two nodes and 79 cliques
with at least three nodes. The biggest sub- network consists of 237 nodes.
The surrounding plethora of small- sized sub- networks is dominated by
higher education organisations. The main sub- network shows not only
universities but also companies and other types of actors placed centrally in
the network and a geographical clustering of collaboration. Notably, a
number of geographical clusters can be identified: (a) an U.S. cluster with a
central position around the U.S. Department of Agriculture and other U.S.
actors, whether universities, public agencies or companies; (b) a western and
central European cluster with the central position of University Wageningen
in the Netherlands, ETH in Switzerland and the University of Ghent in
Belgium; (c) a small Canadian- French cluster around the University of
Toronto; (d) a small Scandinavian cluster; and (e) a small South American
cluster with Universidad Estadual Campinas in Brazil. Other regions are less
centrally positioned in the network and are more linked to the outer borders
of some of these clusters, such as East Asian actors to the U.S. cluster.
In order to get an idea of where the bioeconomy is discussed, we identified the main scientific fields in the sample. Papers are mostly listed under
several categories. Therefore, weighted counts have been applied. The sample
included 99 Web of Science categories, which represents a very dispersed
Table 2.6 The 10 most prominent organisations in terms of number of papers (n = 99,
fraction counts) and Freeman’s degree centrality in co-authorship networks;
values for Freeman’s betweenness centrality are added
Organisation
Number
of papers
Degree
centrality
Betweenness
centrality
Wageningen University & Research Centre
19.2
8.200
9,471.480
Iowa State University
17.6
1.861
1,529.762
U.S. Department of Agriculture
15.4
3.242
11,896.121
University of Ghent
12.0
3.003
9,493.600
University of Utrecht
7.2
2.000
1,145.533
University of York
5.8
1.833
933.000
Lund University
5.8
0.833
235.000
Michigan State University
5.5
0.867
0.000
University of Florida
5.3
0.333
0.000
Cardiff University
4.8
0.833
1,782.586
Note
Degree centrality is defined as the number of links that a node has (Borgatti, 2005), while
betweenness centrality is defined as the number of times a node acts as a bridge along the shortest path between two other nodes (Freeman, 1977). Centrality measures for degree centrality
and betweenness centrality have been calculated with UCINET 6.