

Multi-level governance of food waste 259
13.3.3 Comparative food waste assessments in Scandinavia
The scale of food waste in the three analysed countries can be divided according to position on the value chain. Food waste quantification in primary production shows that Denmark is in the lead (288,000 tons), followed by Sweden
(277,000 tons) and Norway (85,000 tons) (Hartikainen et al., 2018, p. 508).
This might be explained by the fact that utilised agricultural areas cover only
3.1% of Norway’s land territory, equalling one million hectares (EUROSTAT, 2012b), while they cover 7% of land and three million hectares in
Sweden (EUROSTAT, 2012c), and as much as 61% and 2.5 million hectares
in Denmark (EUROSTAT, 2012a). Taking into account these agricultural
areas, relative food waste from primary production is quite comparable, yet
Denmark is still in the lead.
Data from the retail sector shows that Sweden had double the amount of
absolute food waste at this stage (83,500 tons per year in the retail sector) but
considering the fact that Sweden has twice the population of Norway (43,000
tons) and Denmark (40,000–46,000 tons), the data seems very comparable
(Stenmarck et al., 2011).
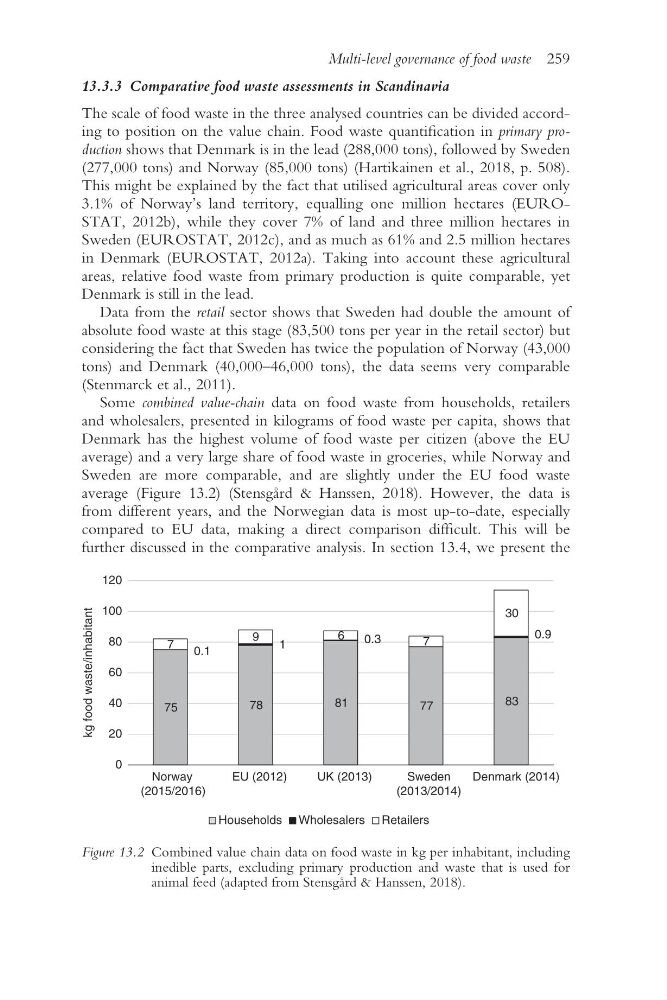
Some combined value- chain data on food waste from households, retailers
and wholesalers, presented in kilograms of food waste per capita, shows that
Denmark has the highest volume of food waste per citizen (above the EU
average) and a very large share of food waste in groceries, while Norway and
Sweden are more comparable, and are slightly under the EU food waste
average (Figure 13.2) (Stensgård & Hanssen, 2018). However, the data is
from different years, and the Norwegian data is most up- to-date, especially
compared to EU data, making a direct comparison difficult. This will be
further discussed in the comparative analysis. In section 13.4, we present the
75
78
81
77
83
0.1
1
0.3
0.9
7
9
6
7
30
0
20
40
60
80
100
120
Norway
(2015/2016)
EU (2012)
UK (2013)
Sweden
(2013/2014)
Denmark (2014)
Households Wholesalers Retailers
kg food waste/inhabitant
Figure 13.2 Combined value chain data on food waste in kg per inhabitant, including
inedible parts, excluding primary production and waste that is used for
animal feed (adapted from Stensgård & Hanssen, 2018).
13.3.3 Comparative food waste assessments in Scandinavia
The scale of food waste in the three analysed countries can be divided according to position on the value chain. Food waste quantification in primary production shows that Denmark is in the lead (288,000 tons), followed by Sweden
(277,000 tons) and Norway (85,000 tons) (Hartikainen et al., 2018, p. 508).
This might be explained by the fact that utilised agricultural areas cover only
3.1% of Norway’s land territory, equalling one million hectares (EUROSTAT, 2012b), while they cover 7% of land and three million hectares in
Sweden (EUROSTAT, 2012c), and as much as 61% and 2.5 million hectares
in Denmark (EUROSTAT, 2012a). Taking into account these agricultural
areas, relative food waste from primary production is quite comparable, yet
Denmark is still in the lead.
Data from the retail sector shows that Sweden had double the amount of
absolute food waste at this stage (83,500 tons per year in the retail sector) but
considering the fact that Sweden has twice the population of Norway (43,000
tons) and Denmark (40,000–46,000 tons), the data seems very comparable
(Stenmarck et al., 2011).
Some combined value- chain data on food waste from households, retailers
and wholesalers, presented in kilograms of food waste per capita, shows that
Denmark has the highest volume of food waste per citizen (above the EU
average) and a very large share of food waste in groceries, while Norway and
Sweden are more comparable, and are slightly under the EU food waste
average (Figure 13.2) (Stensgård & Hanssen, 2018). However, the data is
from different years, and the Norwegian data is most up- to-date, especially
compared to EU data, making a direct comparison difficult. This will be
further discussed in the comparative analysis. In section 13.4, we present the
75
78
81
77
83
0.1
1
0.3
0.9
7
9
6
7
30
0
20
40
60
80
100
120
Norway
(2015/2016)
EU (2012)
UK (2013)
Sweden
(2013/2014)
Denmark (2014)
Households Wholesalers Retailers
kg food waste/inhabitant
Figure 13.2 Combined value chain data on food waste in kg per inhabitant, including
inedible parts, excluding primary production and waste that is used for
animal feed (adapted from Stensgård & Hanssen, 2018).