

166 S. Bolwig et al.
& Ketterings, 2016), while acid casein whey has a pH of 4.5–5.1 (Jelen,
2011). Overall, compared to sweet whey, acid whey has less protein, is more
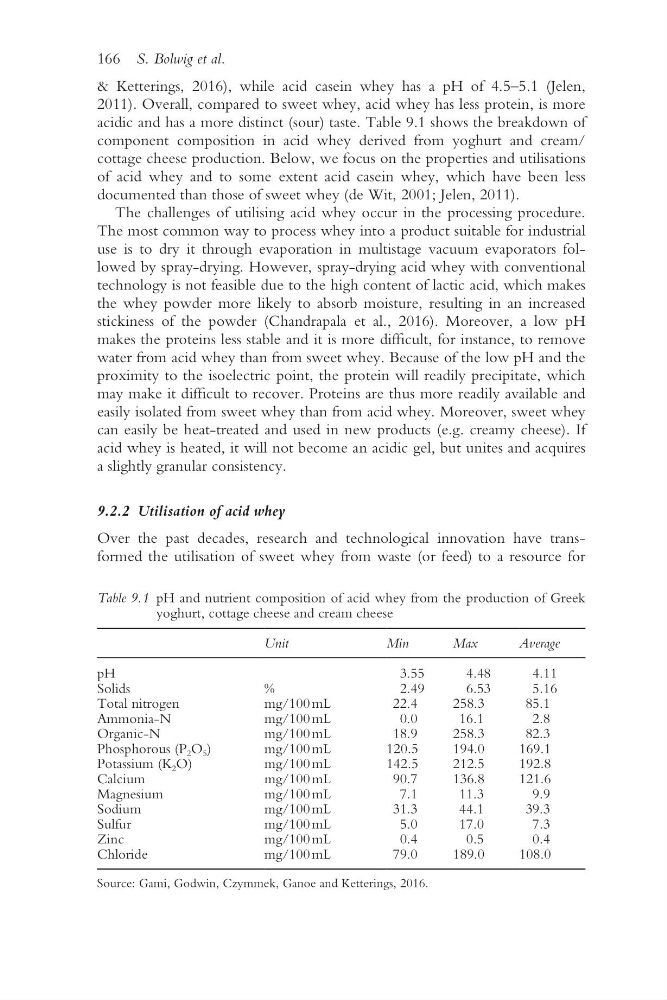
acidic and has a more distinct (sour) taste. Table 9.1 shows the breakdown of
component composition in acid whey derived from yoghurt and cream/
cottage cheese production. Below, we focus on the properties and utilisations
of acid whey and to some extent acid casein whey, which have been less
documented than those of sweet whey (de Wit, 2001; Jelen, 2011).
The challenges of utilising acid whey occur in the processing procedure.
The most common way to process whey into a product suitable for industrial
use is to dry it through evaporation in multistage vacuum evaporators followed by spray- drying. However, spray- drying acid whey with conventional
technology is not feasible due to the high content of lactic acid, which makes
the whey powder more likely to absorb moisture, resulting in an increased
stickiness of the powder (Chandrapala et al., 2016). Moreover, a low pH
makes the proteins less stable and it is more difficult, for instance, to remove
water from acid whey than from sweet whey. Because of the low pH and the
proximity to the isoelectric point, the protein will readily precipitate, which
may make it difficult to recover. Proteins are thus more readily available and
easily isolated from sweet whey than from acid whey. Moreover, sweet whey
can easily be heat- treated and used in new products (e.g. creamy cheese). If
acid whey is heated, it will not become an acidic gel, but unites and acquires
a slightly granular consistency.
9.2.2 Utilisation of acid whey
Over the past decades, research and technological innovation have transformed the utilisation of sweet whey from waste (or feed) to a resource for
Table 9.1 pH and nutrient composition of acid whey from the production of Greek
yoghurt, cottage cheese and cream cheese
Unit
Min
Max
Average
pH
3.55
4.48
4.11
Solids
%
2.49
6.53
5.16
Total nitrogen
mg/100 mL
22.4
258.3
85.1
Ammonia-N
mg/100 mL
0.0
16.1
2.8
Organic-N
mg/100 mL
18.9
258.3
82.3
Phosphorous (P 2 O 5 )
mg/100 mL
120.5
194.0
169.1
Potassium (K 2 O)
mg/100 mL
142.5
212.5
192.8
Calcium
mg/100 mL
90.7
136.8
121.6
Magnesium
mg/100 mL
7.1
11.3
9.9
Sodium
mg/100 mL
31.3
44.1
39.3
Sulfur
mg/100 mL
5.0
17.0
7.3
Zinc
mg/100 mL
0.4
0.5
0.4
Chloride
mg/100 mL
79.0
189.0
108.0
Source: Gami, Godwin, Czymmek, Ganoe and Ketterings, 2016.
& Ketterings, 2016), while acid casein whey has a pH of 4.5–5.1 (Jelen,
2011). Overall, compared to sweet whey, acid whey has less protein, is more
acidic and has a more distinct (sour) taste. Table 9.1 shows the breakdown of
component composition in acid whey derived from yoghurt and cream/
cottage cheese production. Below, we focus on the properties and utilisations
of acid whey and to some extent acid casein whey, which have been less
documented than those of sweet whey (de Wit, 2001; Jelen, 2011).
The challenges of utilising acid whey occur in the processing procedure.
The most common way to process whey into a product suitable for industrial
use is to dry it through evaporation in multistage vacuum evaporators followed by spray- drying. However, spray- drying acid whey with conventional
technology is not feasible due to the high content of lactic acid, which makes
the whey powder more likely to absorb moisture, resulting in an increased
stickiness of the powder (Chandrapala et al., 2016). Moreover, a low pH
makes the proteins less stable and it is more difficult, for instance, to remove
water from acid whey than from sweet whey. Because of the low pH and the
proximity to the isoelectric point, the protein will readily precipitate, which
may make it difficult to recover. Proteins are thus more readily available and
easily isolated from sweet whey than from acid whey. Moreover, sweet whey
can easily be heat- treated and used in new products (e.g. creamy cheese). If
acid whey is heated, it will not become an acidic gel, but unites and acquires
a slightly granular consistency.
9.2.2 Utilisation of acid whey
Over the past decades, research and technological innovation have transformed the utilisation of sweet whey from waste (or feed) to a resource for
Table 9.1 pH and nutrient composition of acid whey from the production of Greek
yoghurt, cottage cheese and cream cheese
Unit
Min
Max
Average
pH
3.55
4.48
4.11
Solids
%
2.49
6.53
5.16
Total nitrogen
mg/100 mL
22.4
258.3
85.1
Ammonia-N
mg/100 mL
0.0
16.1
2.8
Organic-N
mg/100 mL
18.9
258.3
82.3
Phosphorous (P 2 O 5 )
mg/100 mL
120.5
194.0
169.1
Potassium (K 2 O)
mg/100 mL
142.5
212.5
192.8
Calcium
mg/100 mL
90.7
136.8
121.6
Magnesium
mg/100 mL
7.1
11.3
9.9
Sodium
mg/100 mL
31.3
44.1
39.3
Sulfur
mg/100 mL
5.0
17.0
7.3
Zinc
mg/100 mL
0.4
0.5
0.4
Chloride
mg/100 mL
79.0
189.0
108.0
Source: Gami, Godwin, Czymmek, Ganoe and Ketterings, 2016.